
Streaks and the Don't Pass Bet
The only math I could do is .273*.6*.6 . = .098 This is sloppy and simple, and doesn't deal with the no decision on 12, but it does show "on average" the one 27.3% chance of winning the come out roll, and the two 60% chances of winning the rolls where a point is established. The Pass line would be .667*.4*.4 = .107 the one 66% chance of winning the come out roll, and the two 40% chances of winning point established rolls. Both would be different from .493*.493*.493 = .1198 My point again is not arguing with the HE, just the streaks, I do this simply because I know a 50/50 game with a 100% chance of winning one roll, and a 100% chance of losing the next roll, would be 50/50, but the streaks would be dramatically affected. So, I guess what I'm trying to establish, is that .493 is the probability for 3 rolls, as opposed to 1 roll, and this should not be used to calculate streaks. This would be based on the example of the 50/50 game where .5*.5*.5 is inaccurate as well, and the 50/50 would be based on 2 rolls.
MustangSally if you have any thoughts I'd love to hear them.
Quote: JyBrd0403I would see this affecting the streaks for the Don't bettor.
It is certainly true that you should have less losing streaks playing the Don't. It's one of the things I like about Darkside betting.
You have a bunch of number crunching to establish this. But what difference does it make? You admit it won't do anything to the HE. Streaks can affect morale, but so can getting paid less than you bet, then realizing a winning streak didn't do you much good.
Quote: odiousgambitIt is certainly true that you should have less losing streaks playing the Don't. It's one of the things I like about Darkside betting.
Just curious about the math right now. Do you have any math that shows this? Or am I correct that the conventional math is done as .493*.493*.493
That should be what are the chances of winning 3 in a row.
silly
Sally
Quote: Dicenor33I like to watch don't bettors, it seems that you can not loose until a good DI shows up and everything you made disappeares in a single roll.

Quote: mustangsallyyes it is
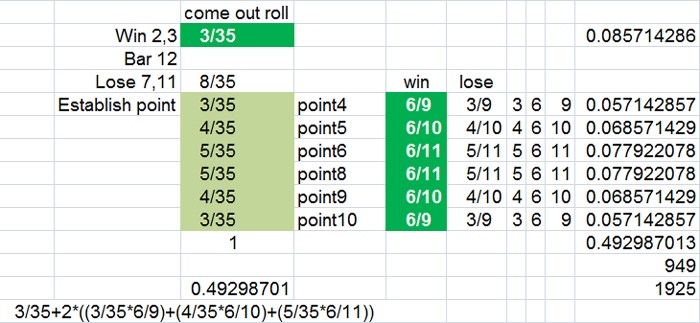
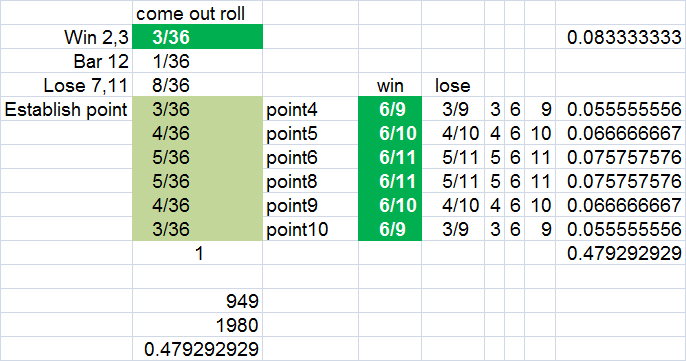
The 49.3% value includes every possible way the don't pass can win - excluding the Bar 12 push.
Here is my proof in the photo below from Excel
949/1925 is the winning probability exactly not counting the bar 12 pushes.
why count them for streaks win or lose?
they mean nothing to the don't player just like a Tie in baccarat. No win or No lose.
next round of play
but if you only want the win probability including the Bar 12 push. That would be 949/1980
.493*.493*.493 is accurate for the very next 3 don't pass win/lose decisions. that = 0.11981
8 possible sequences in 3 trials (1=success and 0=failure)
1 1 1 yes
1 1 0
1 0 1
1 0 0
0 1 1
0 1 0
0 0 1
0 0 0
But the probability is higher for say 5 trials.
Now there are 32 possible sequences
1 1 1 1 1 yes
1 1 1 1 0 yes
1 1 1 0 1 yes
1 1 1 0 0 yes
1 1 0 1 1
1 1 0 1 0
1 1 0 0 1
1 1 0 0 0
1 0 1 1 1 yes
1 0 1 1 0
1 0 1 0 1
1 0 1 0 0
1 0 0 1 1
1 0 0 1 0
1 0 0 0 1
1 0 0 0 0
0 1 1 1 1 yes
0 1 1 1 0 yes
0 1 1 0 1
0 1 1 0 0
0 1 0 1 1
0 1 0 1 0
0 1 0 0 1
0 1 0 0 0
0 0 1 1 1 yes
0 0 1 1 0
0 0 1 0 1
0 0 1 0 0
0 0 0 1 1
0 0 0 1 0
0 0 0 0 1
0 0 0 0 0
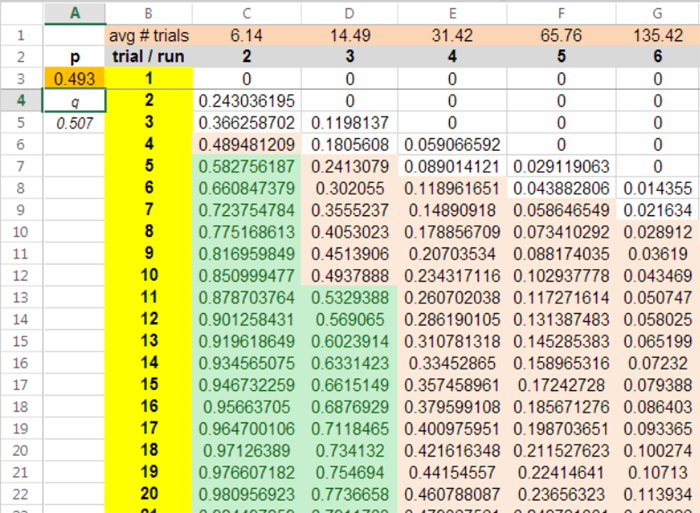
This can be easily calculated in Excel. My sheet for that shows
3 in a row over 5 don't pass win/lose bets = 0.241307879
Streak Calculator
Why the interest in the Don't Pass win streaks?
Sally
Hey Sally, how have you been? Happy Holidays! I'll try not to get too confusing here, but, the .493 would be considered an "average" win percentage in this case wouldn't it? What I mean is that you have to take all 36 rolls into consideration, and then take the average win percentage to get the .493. In "reality" 2 out of 3 trials will be in the Don't bettors favor, either 55%, 60%, or 66% in their favor(avg. 60%). 1/3 of the trials will be at a big disadvantage 27% or so, for the don't bettor. That is the "reality" of what happens when 1/3 of the rolls will be decided on the come out roll, and 2/3 decided after a point is established. So, the problem I would see with your chart above, would be that it doesn't take into consideration which rolls were decided on the come out rolls, and which were decided after a point was established. It just shows each roll having a .493 chance of winning(which is actually incorrect), but not the "reality" getting 2 60% plays every 3 rolls which would affect the streaks. One roll decided at the come out, and 2 rolls decided after a point is established. Does that make any sense?
I understand that each roll would have a .493 chance of winning on average, but in this rare case of Don't Pass and Pass Line bets, the "reality" is that 1/3 will be decided at the come out (which would be 12/36) and 2/3 after a point is established (24/36). You're charts, in this case, are not able to show which rolls went to a point and which ones were decided at the come out. My point is that if .27*.6*.6 and .493*.493*.493 both produced the same results there wouldn't be anything to discuss, but since they produce different results, I would have to question the accuracy of the math that can't show which results were decided by the come out roll and which were decided by points that were established. The conventional math just shows all decisions at the average .493 winning percntage, which is not what would happen in reality. A quick example is that the come out rolls that decisions are made on (12/36) only have a 27% chance of winning, it NEVER goes to the 2nd roll. The whole decision was made on 1 roll, so there never was the average .493 win percentage on those single rolls. So using the .493 avg win in this case is inaccurate, and really shows that using the .493 avg. win to calculate streaks is an invalid way of calculating streaks in this case. 1/3 of all decisions are only 1 roll and therefore do not have a .493 chance of winning. That can't be argued. It pretty much invalidates the math right there IMO.
If I could ask the question another way, lets say you had 3 different games, one had a 27% chance of winning, a second had a 60% chance of winning, and a 3rd had a 60% chance of winning. You must bet the 27% game first, then the 60%, and finally the next 60%. The average winning percentage would be .493, but how would you calculate the streaks in this case? If you take the avg. win percentage .493 you'd get a different result then if you did .27*.6*.6 or .6*.27*.6 or .6*.6*.27
You see what I mean? The avg. doesn't take into account the reality of the actual play of the game. The winning percentage would be accurate for both, but the streaks would be different.
silly
Sally
Quote: mustangsallywhat - you can not *see* the 3/35 on the come out roll.
Oh, Maybe my shades of green highlights are missing in your browser.
start with 3/35 for the 2 and the 3 on the come out roll - 3rd column,
2nd row and get back to us.
the far right column has the decimal values of each fraction
You do agree there are 3 out of the 35 possible roll combinations (we are not counting the 12 here)
that make the don't pass to win on the come out roll. (1-1, 1-2 and 2-1)
I do not see that.
post a pic of what you see.
not one of outside.
you must be watching Cheers re-runs as you read my post. (I like Cheers)
the problem I see, really, is
all these words you posted are totally meaningless. They pull on my teeth as I try to read them.
Why is that? I have beautiful teeth.
Maybe a different kind of formatting would help?
I can not find even a funny joke.
Have fun
Sally
I'm a Die Hard Cub Fan and Bud Man, as always Sally :) Actually, I'm watching Mr. Holland's Opus right now(Bud in hand), haven't seen Cheers in a while (Great show wasn't it). But, see, you never answer my questions :) How have you been? How's life treatin' ya? Have you seen any good movies lately? Did you catch any of the "Banksy" New York Residency?
The green did show up on my browser, but it showed these weird fraction thingies like 3/35, 3/35, 4/35, 5/35, 5/35, 4/35, 3/35 which led me to believe that the conclusions were based on the averages of 36 rolls of the dice(excluding the 12). Is this the case? Is this an average winning percentage for 36 trials, as opposed to the winning percentage for each individual trial?
If you play roulette (single 0), EACH individual spin has a 18/37 chance of winning for Red or Black. That's Each individual spin. This is not an average of the 37 spins, it is for EACH individual spin. I don't believe that is the case for Don't Pass and Pass Line bets. What do you think? Is it an average of 36 rolls or each individual roll?
Can't post any pics, doing all this in my head and on calculator, also I think I would have to open one of those instagram account thingies. That would take me a week to figure out, and the html code, haven't dealt with that in years. Plus I'm not even sure exactly how the correct math would be done. Again, .27*.6*.6 would also be an average, the only difference is it would show the 1/3 outcomes on 1 roll come out decisions(that are clearly not .493) and the 2/3 established point decisions which are not accounted for by conventional streak math. IDK .27*.6*.6 may be accurate though, who knows? I just know that's not how mathematicians do it.
Anyway, Sally, you pretty much answered my question about the conventional math, it would be done as .493*.493*.493. I'll not argue that this is how mathematicians do the math (that's how I figured they do it). Is there any other way of doing the math for this question that you know of? And, does this method have flaws that you can envision?
Quote: JyBrd0403in this rare case of Don't Pass and Pass Line bets
Where is this coming from all of a sudden?
Quote:The conventional math just shows all decisions at the average .493 winning percntage
But she showed you how she derived this 0.493, factoring in points that were established, weighting the probabilities. You seem to have it in your head that once a point is established, the math couldn't possibly have anticipated that. Wrong. It did.
See if you can pass the quiz,
[from wikipedia]
PS: I take the Statler and Waldorf defense here.
Ofcourse a "streak" of Establish a Point/Make That Point might also occur and that is a streak that will kill the bankroll of a Wrong Way bettor.
That's my logic. Seems sound to me.
Quote: JyBrd0403It occurs to me that I may not have been exactly clear on my points in previous posts. I'll try to clarify this a little. My point is if you bet the Don't Pass and a 7 hits you lose the point. Only 1 roll of the dice occurs in this case. There never was a .493 chance of winning on these occasions. Therefore, using .493 as the winning percentage for each decision would be inaccurate, as not every decision has a .493 chance of winning.
That's my logic. Seems sound to me.
The fallacy in your logic is that you are trying to apply a probability of all possible outcomes to a single discrete outcome.
When you made your DP bet you did not have foreknowledge how it would be resolved. It could lose to a 7 or 11 or it could win on a 2 or 3, or a point could be established and you would then have to wait for that point to be resolved.
When you placed the bet you had a .493 chance of winning it.
If a 7 rolls or a point is established and then 7 rolls, these are samples of the events that make up Sally's table which is a mathematical representation of what actually happens over a very large sample on the craps table. You can't pull out one of those samples out of the whole and claim the .493 doesn't apply.
Quote: seattlediceThe fallacy in your logic is that you are trying to apply a probability of all possible outcomes to a single discrete outcome.
When you made your DP bet you did not have foreknowledge how it would be resolved. It could lose to a 7 or 11 or it could win on a 2 or 3, or a point could be established and you would then have to wait for that point to be resolved.
When you placed the bet you had a .493 chance of winning it.
If a 7 rolls or a point is established and then 7 rolls, these are samples of the events that make up Sally's table which is a mathematical representation of what actually happens over a very large sample on the craps table. You can't pull out one of those samples out of the whole and claim the .493 doesn't apply.
"fallacy" that may be a word you might want to stay away from in this discussion. Up to you, but, that word can be applied both ways.
You're right, I can't pull out one example, I can pull out 1/3 of the examples and say .493 doesn't apply to them.
What's in question, is when I place the bet what exactly are the chances of winning this one particular bet. On average it will be .493 for 36 rolls of the dice, but on the individual trial, in 1/3 of the cases that won't apply. So, "fallacy" kind of falls on your side of the fence.
Now the point of this is that streaks are calculated as each individual trial having a .493 chance of winning, not an average .493 chance of winning. Again, if you had a game where you won 100% on the first roll and lost 100% on the second roll. You would have a 50/50 game, but the streaks would not be the same as a game where EACH trial has a 50/50 chance of winning. You just can't use your "fallacy" in this case.
The "fallacy" is that he has a 49.3% chance of getting a hit every time he steps to the plate. He doesn't.
"Chance"??? Who knows? Expected value? Definitely yes.Quote: JyBrd0403My point is if you bet the Don't Pass and a 7 hits you lose the point. Only 1 roll of the dice occurs in this case. There never was a .493 chance of winning on these occasions. Therefore, using .493 as the winning percentage for each decision would be inaccurate, as not every decision has a .493 chance of winning.
Quote: JyBrd0403It occurs to me that I may not have been exactly clear
The word "fallacy" is strongly pejorative, I recognized that when I threw that out there in the clothing of a joke [which can make it even worse], but honestly I have to say the invincible ignorance fallacy what we might call the "invincible blindness syndrome" seems to be at the heart of the problem here. I'll concede the blindness may be on my part, as I cannot grasp your argument if it indeed is not invalid in a circular way.
Quote: JyBrd0403My point is if you bet the Don't Pass and a 7 hits you lose ... Only 1 roll of the dice occurs in this case. There never was a .493 chance of winning on these occasions. Therefore ...not every decision has a .493 chance of winning.
I think you have agreed that 0.493 is valid for one bet, before the dice are rolled. Are you having a problem with the idea that, in a streak, once the first step is a loss, a winning streak is impossible? Absolutely this is true. But at the outset, wondering if the shooter is going to win three times in a row, we don't know the outcome of the first leg. It doesn't matter at what stage the streak fails, the probability of the streak event at the outset, before any dice are rolled, is correctly defined by the formula. This has been long established and easily proven also by data. You could do the experiment yourself. I'd use an online dice roller and I would use a very simple proposition like "how often is there a streak of three sixes in a row rolled by one die?"
I can suggest this site for rolling dice, as it will email you the results. You do have to register, but it is worth it.
http://acts.warhorsesim.com/
Quote: JyBrd0403To try a different analogy. You have a Cub hitter who has a .493 average for the season. You would say he has a 49.3% chance of getting a hit his next at bat. I would say that his average depends on the pitcher he's facing. Some pitchers he only hits 27% of the time, others he hits 60% of the time. We know 2/3 of the time he faces pitchers he hits 60% on, and 1/3 he hits 27%. So, how would you calculate a streak. .493*.493*.493 or .27*.6*.6 . I would think the latter would be more accurate, since in reality that's what will happen.
The "fallacy" is that he has a 49.3% chance of getting a hit every time he steps to the plate. He doesn't.
Take a look at how Don't Pass/Don't Come is calculated on https://wizardofodds.com/games/craps/appendix/1/
It clearly shows the probability of winning/losing (.4793 - not sure where you are getting .493 as that is a Pass Line Win or Don't Pass Loss) takes into account comeout-win and point-established-then-win both at the same time.
Quote: wudged(.4793 - not sure where you are getting .493 as that is a Pass Line Win or Don't Pass Loss)
I'm blind again, I don't see the figure 0.4793 on that page.
In fact it would suggest a house edge of about 4%, wouldn't it?
That is the probability of flat out winning, disregarding pushes on a come out 12, so the edge is not that high.
Quote: wudgedThat exact figure is actually on https://wizardofodds.com/games/craps/ but is expressed on the appendix page as 2847/5940
That is the probability of flat out winning, disregarding pushes on a come out 12, so the edge is not that high.
Then it must be about whether or not you count pushes. I think Sally put out two versions if you go back to her posts.
I missed that post for some reason, so my reply about referring to the Wizard will be of no use if he completely disregarded her posts anyway..
Oh well, keep on searching for that holy grail!
Quote: JyBrd0403"fallacy" that may be a word you might want to stay away from in this discussion
You said your logic was sound. It's not. "Fallacy," is one word I can use. I could also use "error" or "mistake" - they all mean the same thing. Which would you prefer?
Quote: JyBrd0403You're right, I can't pull out one example, I can pull out 1/3 of the examples and say .493 doesn't apply to them.
What's in question, is when I place the bet what exactly are the chances of winning this one particular bet. On average it will be .493 for 36 rolls of the dice,
So you agree with the math ...
Quote: JyBrd0403but on the individual trial, in 1/3 of the cases that won't apply. So, "fallacy" kind of falls on your side of the fence.
and then you want to ignore 1/3 of the results?
All the cases have to be included to get to the .493. This is the correct number to use when you walk up to the table and want to answer the question, "What are the chances that I'll have a streak of N wins?"
When you say you can pull out 1/3 of cases, I assume you are talking about the rolls where the bet is resolved on the come out. Look at the table - the first three rows account for this. In this sample of 1/3 of the possible rolls, you win 3 times, lose 8 and push 1, so ignoring the push on the 12, we are looking at 3 wins in 11 outcomes. But those 11 outcomes are only 11 of the 35 possible come out rolls, so 11/35 of the time you win 3/11 of the time (11/35 * 3/11 = .085714286). This is the contribution to the overall chance of a win of the 1/3 of the samples that you want to pull out.
When you state a specific outcome has happened it is no longer a random event. You can calculate the chances that a specific series of outcomes will occur and the result will almost certainly not be the same as using the averages.
There is a difference between calculating the average of what might happen and the chances of some specific series of rolls. You shouldn't compare these two different types of calculations.
Quote: seattlediceYou said your logic was sound. It's not. "Fallacy," is one word I can use. I could also use "error" or "mistake" - they all mean the same thing. Which would you prefer?
So you agree with the math ...
and then you want to ignore 1/3 of the results?
All the cases have to be included to get to the .493. This is the correct number to use when you walk up to the table and want to answer the question, "What are the chances that I'll have a streak of N wins?"
When you say you can pull out 1/3 of cases, I assume you are talking about the rolls where the bet is resolved on the come out. Look at the table - the first three rows account for this. In this sample of 1/3 of the possible rolls, you win 3 times, lose 8 and push 1, so ignoring the push on the 12, we are looking at 3 wins in 11 outcomes. But those 11 outcomes are only 11 of the 35 possible come out rolls, so 11/35 of the time you win 3/11 of the time (11/35 * 3/11 = .085714286). This is the contribution to the overall chance of a win of the 1/3 of the samples that you want to pull out.
When you state a specific outcome has happened it is no longer a random event. You can calculate the chances that a specific series of outcomes will occur and the result will almost certainly not be the same as using the averages.
There is a difference between calculating the average of what might happen and the chances of some specific series of rolls. You shouldn't compare these two different types of calculations.
Again your "fallacy" is that you can use averages to determine streaks, you can't. I've given the baseball example and the game where you win 100% on the first trial and lose 100% of the time the second trial, both show your use of averages to determine streaks as a big "fallacy", mistake, error.
I do agree that .493 is the average of all possible outcomes, that's just how the game works. The pass line and don't pass have 2 "events" that occur, the come out roll, and the event after a point is established. You have to take an average of the 2 events to get .493. This is obviously true, because 1/3 of the time a point is never established. So obviously .493 is an average win percentage. That's fine. The problem is you can't use averages to determine streaks. I've given examples of the Baseball player and the win 100% on the first trial lose 100% on the second trial, to demonstrate this.
I would love to hear your answer for a game where you win 100% of the time on the first roll, and lose 100% on the second roll(you must make 2 rolls). Are your chances of winning 3 in a row .5*.5*.5 = 12.5% or are they actually 0%.
I'm trying to point out the using averages to determine streaks is inaccurate in my view. So, if you can answer the question above, that may help me understand your point better.
Quote: JyBrd0403I do agree that .493 is the average of all possible outcomes, that's just how the game works. The pass line and don't pass have 2 "events" that occur, the come out roll, and the event after a point is established. You have to take an average of the 2 events to get .493. This is obviously true, because 1/3 of the time a point is never established. So obviously .493 is an average win percentage. That's fine. The problem is you can't use averages to determine streaks. I've given examples of the Baseball player and the win 100% on the first trial lose 100% on the second trial, to demonstrate this.
I would love to hear your answer for a game where you win 100% of the time on the first roll, and lose 100% on the second roll(you must make 2 rolls). Are your chances of winning 3 in a row .5*.5*.5 = 12.5% or are they actually 0%.
I'm trying to point out the using averages to determine streaks is inaccurate in my view.
But you're using an example that features interdependent events. Craps, like any other gambling game, is independent -- unlike your flip-flop example above, the question of winning or losing the second wager has nothing to with the first.
The baseball analogy is also inapt -- it's clear that you can use additional information like whether the batter is facing a lefty or a righty to increase your estimation of probability. In fact, those split statistics are also published. Miggy Cabrera hit .348 last year, but .368 against lefties. If he comes to bat against a lefty, you don't think "he's only got a 34.8% chance of getting on base" because you have additional information.
However, there is no information that you can use to conditionally inform the probability of winning a passline bet prior to it starting. You don't know what you're going to roll on the comeout roll, and the past wager has no impact on the next one. The unconditional probability of winning a passline bet is 244/495, period. It's certainly true that the conditional probability of winning the passline is far less if your first roll is 4, but it's just as true that the conditional probability of winning the passline is (or was) 100% if your first roll is 11, and 0% if your first roll is 3.
Here's an exercise: break down the passline into its component parts, comeout and post-comeout. Determine the probability of a streak of 3 passline wins for each possible permutation of component outcomes. Then weight them according to their probabilities and add them up. Here's a start: the probability of 3 come-out losses is 1/729, which doesn't count as a successful 3-streak. The probability of 3 come-out wins is 8/729, which does. You do the rest.
It turns out the result will equal 19927/166375, or exactly the same as just taking the overall probability of a win (244/495) and cubing it.
Quote: MathExtremistHowever, there is no information that you can use to conditionally inform the probability of winning a passline bet prior to it starting. You don't know what you're going to roll on the comeout roll, and the past wager has no impact on the next one. The unconditional probability of winning a passline bet is 244/495, period. It's certainly true that the conditional probability of winning the passline is far less if your first roll is 4, but it's just as true that the conditional probability of winning the passline is (or was) 100% if your first roll is 11, and 0% if your first roll is 3.
Here's an exercise: break down the passline into its component parts, comeout and post-comeout. Determine the probability of a streak of 3 passline wins for each possible permutation of component outcomes. Then weight them according to their probabilities and add them up. Here's a start: the probability of 3 come-out losses is 1/729, which doesn't count as a successful 3-streak. The probability of 3 come-out wins is 8/729, which does. You do the rest.
It turns out the result will equal 19927/166375, or exactly the same as just taking the overall probability of a win (244/495) and cubing it.
I understand what your saying here. I don't know how else to explain that this is an average of all possible outcomes. Here's what I would say. I would say you have a 27% chance of winning 1/3 of your trials, and 60% chance of winning 2/3 of your trials, as a Don't Pass better. 1/3 of the trials will be settled on the come out roll, and 2/3 will be decided on an established point.
My guess is you're going to say each trial is .493 chance of winning. I'm offering the reality of what will happen, and your giving an average chance of winning. Somebody's streaks are going to be off. That's all I'm saying.
Quote: JyBrd0403I understand what your saying here. I don't know how else to explain that this is an average of all possible outcomes. Here's what I would say. I would say you have a 27% chance of winning 1/3 of your trials, and 60% chance of winning 2/3 of your trials, as a Don't Pass better. 1/3 of the trials will be settled on the come out roll, and 2/3 will be decided on an established point.
My guess is you're going to say each trial is .493 chance of winning. I'm offering the reality of what will happen, and your giving an average chance of winning. Somebody's streaks are going to be off. That's all I'm saying.
I think you're agreeing with me, you just don't know it. If you actually compute the probability of the chances of a 3-streak in the way you propose, where you break it down into your 1/3 vs. 2/3 trials, you'll see that the final probability is exactly the same as just doing it using the overall average. Go ahead and try.
I go with nobody's streaks will be off from expectation.Quote: JyBrd0403My guess is you're going to say each trial is .493 chance of winning.
I'm offering the reality of what will happen, and your giving an average chance of winning.
Somebody's streaks are going to be off. That's all I'm saying.
If they are, I do not see it in actual data.
Streak distribution is based from winning and losing probabilities.
For bets that can win at different steps in different rounds of play, the total is the value to use.
both the pass line and don't pass streaks are as calculated using total win probability for both rounds of play.
the don't pass win streaks
the Zumma actual 35,097 dice rolls from 2 Las Vegas casinos
I see a distribution based from the winning probabilities from both rounds.
Here are the DPass win streaks with the expected number from the total win probability of 949/1925
a push does not break or stop a win streak
# of decisions: 10338
wins: 5112
win percentage: 49.448636%
proba of a win: 49.298701%
standard deviation of win percentage over 10,338 bets: 0.4917%
the lose streaks are also very close as are both from the pass line bets.
(maybe I post those later once I get them on the same page and the percentages for each length also)
| win streak length | freq | or less | expected number | or less | diff | or less |
|---|---|---|---|---|---|---|
| 1 | 1359 | 1359 | 1310.363723 | 1310.363723 | 48.63627745 | 48.63627745 |
| 2 | 641 | 2000 | 645.9298221 | 1956.293545 | -4.929822096 | 43.70645535 |
| 3 | 328 | 2328 | 318.404214 | 2274.697759 | 9.595785972 | 53.30224132 |
| 4 | 162 | 2490 | 156.9539586 | 2431.651717 | 5.04604139 | 58.34828271 |
| 5 | 70 | 2560 | 77.36877782 | 2509.020495 | -7.368777822 | 50.97950489 |
| 6 | 28 | 2588 | 38.13811247 | 2547.158608 | -10.13811247 | 40.84139242 |
| 7 | 18 | 2606 | 18.79977492 | 2565.958382 | -0.799774921 | 40.0416175 |
| 8 | 13 | 2619 | 9.267148029 | 2575.225531 | 3.732851971 | 43.77446947 |
| 9 | 5 | 2624 | 4.568141488 | 2579.793672 | 0.431858512 | 44.20632799 |
| 10 | 1 | 2625 | 2.251816459 | 2582.045488 | -1.251816459 | 42.95451153 |
| 11 | 1 | 2626 | 1.110008814 | 2583.155497 | -0.110008814 | 42.84450271 |
| 12 | 1 | 2627 | 0.547166956 | 2583.702664 | 0.452833044 | 43.29733576 |
| 13 | 1 | 2628 | 0.269720088 | 2583.972384 | 0.730279912 | 44.02761567 |
Maybe you can run some other sets of dice rolls to show that your point of view is the correct one.
I would be interested in seeing that data.
I can run larger simulations also if needed.
If the streaks were different as you say they should be, how could that information be used?
That sounds interesting too.
Craps is just so damn interesting.