May 10th, 2014 at 8:46:30 PM
permalink
It would be fascinating to see the statistical distribution of different games rather than just the edge (mean) and the standard deviation. The skewness is also important in deciding how and what to play. For instance, video poker has a great edge and a large SD but the distribution must be highly skewed thanks to so much of the return coming from the royal and straight flushes. To have all of the distributions from BJ, Craps (0 odds and 345X), Roulette, PaiGow Poker, Baccarat, Video Poker, etc. ON THE SAME GRAPH would be Very Valuable.
Can someone direct me to a post or website that has this information? For instance, with a bankroll of 100 units on a 1 unit table betting 100 units (1 hour of play), what is the expected outcome distribution?
Can someone direct me to a post or website that has this information? For instance, with a bankroll of 100 units on a 1 unit table betting 100 units (1 hour of play), what is the expected outcome distribution?
May 11th, 2014 at 1:21:28 AM
permalink
Usually the Wizard posts for most games a complete probability list for all events. From that you can compute any cumulant (EV, variance, skewness, kurtosis ...) you like.
But usually, skewness itself is not that much important -you are usually interested in game results after a large number of plays.
Anyway, for a single X payout bet hitting with probability p, skewness is defined as <X^3> - 3*<X^2>*<X>, yielding X^3*(p - 3 * p^2) per sqrt[3](unit bet).
This applies to bets like roulette, baccarat and possibly craps.
For jackpot-like games like video poker, you could try to model the game as a "base" game with normal distributional return defined by EV and variance combined with and single jackpot game. Since the jackpot hits so rarely and payouts are so differently, for a good approximation you can then assume that the jackpot game is independent of the base game (which of course it isn't). Then use the additivity of any cumulant (EV, variance and skewness) to estimate the skewness of the overall game.
May 13th, 2014 at 10:48:43 AM
permalink
It would have to be such a large chart to see enough of the information I would think.Quote: longtimelancerTo have all of the distributions from BJ, Craps (0 odds and 345X), Roulette, PaiGow Poker, Baccarat, Video Poker, etc. ON THE SAME GRAPH would be Very Valuable.
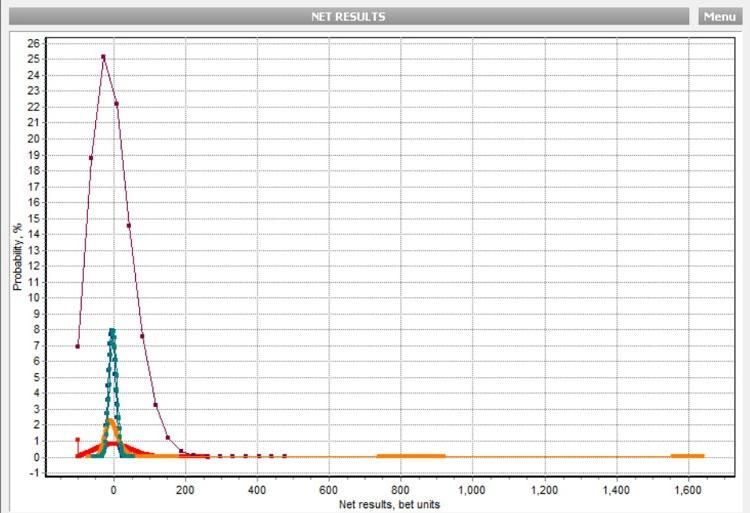
doing this in Excel looks awful
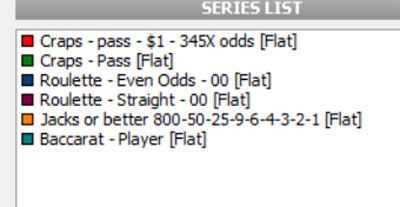
here is an example of something I do use
IMO, not at all interesting
The video poker especially as I used 1 unit for it
and roulette single number bet makes all the other distributions way too small to see any detail


I do not know.Quote: longtimelancerCan someone direct me to a post or website that has this information? For instance, with a bankroll of 100 units on a 1 unit table betting 100 units (1 hour of play), what is the expected outcome distribution?
One could use convolution on each payout table and plot it in a spreadsheet
That would take some coding and effort
Using the normal distribution for 100 bets is useless for video poker for 100 hands played
probably a summary breakdown (table of net result intervals) would be more useful
maybe not
plus the larger the number of trials the total skew tends to 0
and the distribution looks very normal
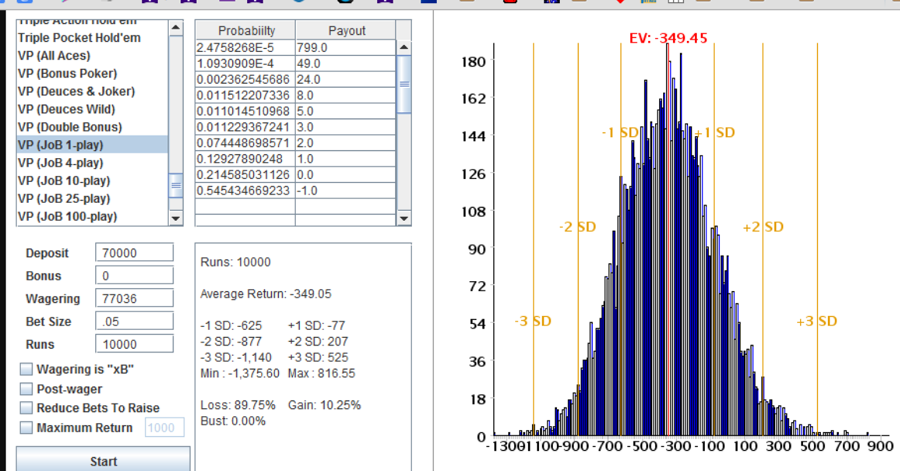
this was about 1.5 million JOB 9/6 VP hands

so even that metric is not really useful
Sally
I Heart Vi Hart
May 13th, 2014 at 11:58:38 AM
permalink
Quote: mustangsallyIt would have to be such a large chart to see enough of the information I would think.
doing this in Excel looks awful
to make the chart more readable, maybe you could create "bins" and sum the discreet probabilities that lie in the same bin together.
May 13th, 2014 at 4:24:16 PM
permalink
Thanks! It might be helpful to normalize the probabilities in order to better compare the distributions. Also, do you have a distribution for Blackjack?


