
Free FullBlackjack Simulator: Any Rules + Any Count System + TC Deviations + C-D Calculator
We’ve previously shared earlier versions of the platform here, but we recently implemented a major upgrade to both the simulation engine and the overall system architecture. The platform is now significantly more robust and optimized than before, and has evolved into what we believe is one of the most comprehensive tools currently available for analyzing blackjack strategies.
We’d like to invite you to try the current version (available on web and mobile).
The simulator is fully online and currently free to use (you ONLY need to log in to run simulations or compute the calculator’s best bet.).
You can:
• Configure any rule set (S17 / H17, ENHC, DAS, decks, penetration, table spots, etc.)
• Choose any counting system (Hi-Lo, Mentor, Uston, Exact Composition, or custom tags)
• Use full True Count–dependent optimal deviations for each counting system
• Define your own TC-dependent betting ramp (net amount or percentage)
• Run simulations and obtain full distributions including EV, variance, and Risk of Ruin.
In addition, we provide a full Composition-Dependent Calculator that allows you to:
• Follow C-D decisions in real time (hit, stand, double, split)
• Follow C-D betting decisions in real time (based on EV, standard deviation, and bankroll).
• Obtain optimal theoretical utility at any moment based on the exact composition of the shoe.
The goal of the project is to precisely model real casino environments under any set of assumptions and allow users to evaluate the true performance of a specific strategy, so they can determine the optimal approach given their own objectives and constraints.
If you find inconsistencies, edge cases, or have technical suggestions, we genuinely appreciate the feedback. Many previous improvements came directly from community input.
You can try it at bjtheorem 'dot' com.
Thanks to everyone who tested earlier versions and contributed feedback.
To give some advice, I recommend that you change the ruleset to allow players to split up to 4 times. In the USA where I live, this is the standard. There are also many places in my country that let you re-split aces, which I think should also be an optional rule.
Also running 2000 rounds of a simulation is not enough at all. When I do it on your website, the results are very different every time.
In our rule configuration, 1 re-split means up to 4 hands total, while 1 split means up to 2 hands. The point about aces is a good one, and we will definitely take that into consideration.
Regarding the number of rounds, it’s not 2,000 rounds in total. The simulations consist of tens of millions of rounds, organized into independent sessions of 2,000 rounds each. This structure helps maintain consistency for strategies where the bet size is bankroll-dependent (percentage betting) and where ruin is possible.
Did you obtain dramatically different profitability metrics? Some variation between runs is expected, but the differences should be relatively small in percentage terms, and the overall scale of the results should remain consistent.
Also, you distinguish player’s seats #1, 2, 3, 4, and 5, but where is the seat #6? I believe it makes no difference between seat #1 and #6. Why do you put so much effort on a seemingly petty thing?
What I mean by 2,000 rounds per session is that each simulation run consists of 2,000 consecutive rounds. The actual real-world time that represents depends on whatever rounds-per-hour pace you want to assume.
So it does not necessarily mean “one literal uninterrupted session” at the table. It is better understood as 2,000 rounds of effective play, which in practice could be distributed across multiple blocks, different days, breaks to go to the restroom, etc.
Regarding the seats, those are configured in Table Rules & Conditions, and you can set the number of occupied seats from 1 up to 5. The seats highlighted in green are the ones played by the user, while the remaining occupied seats are played by bots following basic strategy.
And about why that feature is there: it was not a huge effort to add. It was fairly straightforward to let the simulator account for which seats are occupied, and it adds extra flexibility for modeling different table conditions.
I agree that the difference between playing seat #1 and seat #5 is probably not very significant. However, the difference between playing with a different number of active spots is meaningful. That is why this parameter still needs to be specified in the simulation. Otherwise, the setup would be ambiguous.
So while seat position itself may not have a major impact, the number of occupied spots definitely can. And in any case, including this option only adds flexibility to the simulator rather than taking anything away. If we thought it had no value at all, we simply would not have included it.
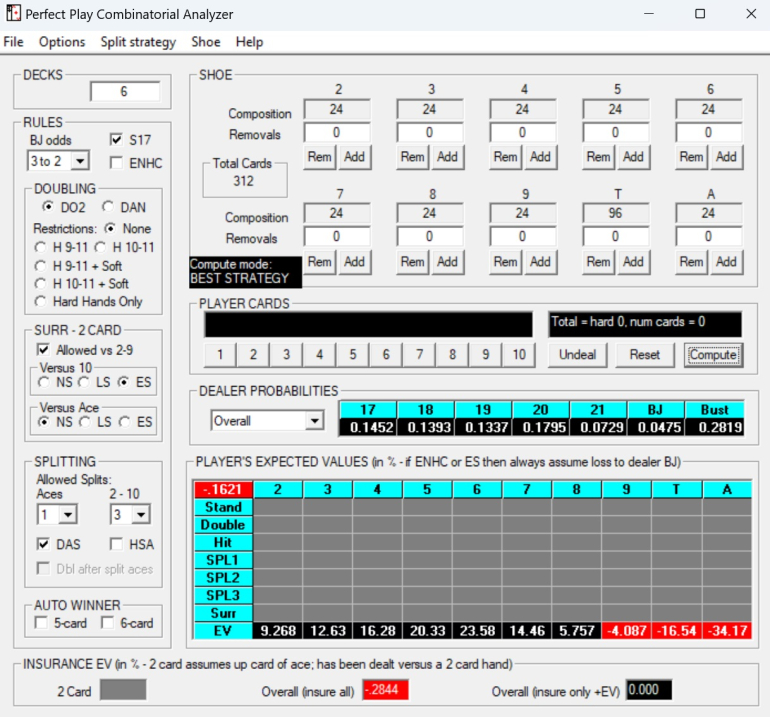
Also, I haven’t found the report part on EV, variance, and risk of ruin. Where are they?
Yes, it can also be very useful for players who are still learning and currently playing with basic strategy. You can simulate the performance of playing strictly according to basic strategy and analyze the results under different rules, penetration levels, and other conditions.
That said, moving toward a counting-based approach is highly recommended, since it can significantly increase your long-term advantage. This does require learning some deviations from basic strategy depending on the count, but the simulator allows you to study and test all of that as well.
Regarding the issue you mentioned: when simulating strategies with 5 player spots at the same time, you’re essentially running one of the most computationally demanding scenarios possible for the simulator. It’s not that it doesn’t work — it’s very likely that the simulation was simply still running. That said, thank you for pointing it out; we’ll definitely look into improving how this case is handled.
As for EV, variance, and risk of ruin: those indicators are located just above the results graph, and they update dynamically as the number of rounds changes using the slider.
EV=$413; STD=$1840 per 2000 rounds.
EV=$16; STD=$393 per 100 rounds.
However, something I don’t understand here. $16x20=$320, which does not match to $413. Could you please explain this to me?
Quote: HackergamblerHi everyone, we are BJTheorem.
We’ve previously shared earlier versions of the platform here, but we recently implemented a major upgrade to both the simulation engine and the overall system architecture. The platform is now significantly more robust and optimized than before, and has evolved into what we believe is one of the most comprehensive tools currently available for analyzing blackjack strategies.
We’d like to invite you to try the current version (available on web and mobile).
The simulator is fully online and currently free to use (you ONLY need to log in to run simulations or compute the calculator’s best bet.).
You can:
• Configure any rule set (S17 / H17, ENHC, DAS, decks, penetration, table spots, etc.)
• Choose any counting system (Hi-Lo, Mentor, Uston, Exact Composition, or custom tags)
• Use full True Count–dependent optimal deviations for each counting system
• Define your own TC-dependent betting ramp (net amount or percentage)
• Run simulations and obtain full distributions including EV, variance, and Risk of Ruin.
In addition, we provide a full Composition-Dependent Calculator that allows you to:
• Follow C-D decisions in real time (hit, stand, double, split)
• Follow C-D betting decisions in real time (based on EV, standard deviation, and bankroll).
• Obtain optimal theoretical utility at any moment based on the exact composition of the shoe.
The goal of the project is to precisely model real casino environments under any set of assumptions and allow users to evaluate the true performance of a specific strategy, so they can determine the optimal approach given their own objectives and constraints.
If you find inconsistencies, edge cases, or have technical suggestions, we genuinely appreciate the feedback. Many previous improvements came directly from community input.
You can try it at bjtheorem 'dot' com.
Thanks to everyone who tested earlier versions and contributed feedback.
link to original post
How to use your bj calculator to find HE of this game ?
Quote: acesideI’ve tried this simulator and found it reliable. Using your Hi-Lo strategy and bet spread of $10/$25/$50/$75/$100 at TC=0/+1/+2/+3/+4, I got these EV and STD numbers:
EV=$413; STD=$1840 per 2000 rounds.
EV=$16; STD=$393 per 100 rounds.
However, something I don’t understand here. $16x20=$320, which does not match to $413. Could you please explain this to me?
link to original post
Hey there. Those numbers don't necessarily have to match, since the risk of ruin means that the expected value doesn't increase linearly over time. However, as you found out when you tested the simulator while writing this, it didn't quite converge, since it only ran up to 60 million rounds. It was updated this week and now runs up to 140 million rounds! Give it a try.
Quote: acesideI’ve tried this simulator again. In the “Playing Strategy” input part, I haven’t found any mention of insurance. So, do these statistics numbers of EV and STD from this simulator include the insurance contribution?
link to original post
They don't include it, friend. We're planning to add insurance soon!
1. I don’t understand this “ Pair payout” input box at all. What is this mix6/col12/perf 25? I’ve never heard of this part. I don’t understand “ PAIRS BETTING TABLE” at all.
2. In the betting method, if I chose Hi-Lo, your TC distribution is greater than 37% when TC>=+1. Other people show that about 27%, so there is inconsistency here.
3. I got EV=$237, STD=$2020 when rounds=2000. But EV=$7, STD=$432 when rounds=100. I don’t know how you did the statistics at these two rounds numbers. If rounds=100, do you shuffle the current shoe and then start a new shoe?
Quote: acesideI’ve tried this simulator. A few things:
1. I don’t understand this “ Pair payout” input box at all. What is this mix6/col12/perf 25? I’ve never heard of this part. I don’t understand “ PAIRS BETTING TABLE” at all.
2. In the betting method, if I chose Hi-Lo, your TC distribution is greater than 37% when TC>=+1. Other people show that about 27%, so there is inconsistency here.
3. I got EV=$237, STD=$2020 when rounds=2000. But EV=$7, STD=$432 when rounds=100. I don’t know how you did the statistics at these two rounds numbers. If rounds=100, do you shuffle the current shoe and then start a new shoe?
link to original post
Pair payout refers to how much the pair side bet pays (mixed pair, colored pair, or perfect pair).
A pairs betting table refers to the strategy for betting on pairs. It specifies two things:
The percentage of hands in which you also place the pair bet
The amount wagered on the pair bet
Regarding the true count (TC) distribution, your numbers are correct (note that this depends on deck penetration). A typical distribution would be approximately:
TC ≥ 1 → 36%
TC ≤ -1 → 36%
TC = 0 → 28%
If, as you mentioned, TC ≥ 1 and TC ≤ -1 were only 27% each, that would imply TC = 0 occurs 46% of the time, which clearly does not make sense. So either there was a mistake in the calculation, or you were looking at a scenario with extremely low penetration.
Finally, simulations are run as independent sessions of 2,000 rounds each, where the shoe is only reshuffled if the cut card is reached.
1. In the “pairs betting table,” you set the betting frequency as 10%, but I don’t know how this is related to the Hi-Lo true count. In other words, what triggers the betting of this side bet?
2. The true count distribution strongly depends on how you process the decimal TC numbers into integers. It looks like you use the Round function, but I personally like the Truncate function. Truncate will simplify the HiLo deviation tables and thus works better for card counting.
3. Now, I can easily get a simulation result with 140 million rounds. This is really powerful! However, these 2000-round segments are not totally independent, because you break some shoes into two different segments. What would you say about this?