
Roulette Wheel Bias Theory vs Practice
I am hoping that this thread can help me separate fact from fiction.
Here is what I have:
7500 Data Points on an automated Wheel.
Number Occurrences Expected Value X2
19 163 196.2105263 5.621202281
35 163 196.2105263 5.621202281
16 164 196.2105263 5.287779535
33 171 196.2105263 3.239228033
27 173 196.2105263 2.745665801
9 175 196.2105263 2.292876101
24 176 196.2105263 2.081770951
26 177 196.2105263 1.880858934
14 177 196.2105263 1.880858934
31 180 196.2105263 1.339281681
11 181 196.2105263 1.179142196
32 184 196.2105263 0.759882539
6 186 196.2105263 0.531341766
23 191 196.2105263 0.138369663
34 194 196.2105263 0.024903998
2 194 196.2105263 0.024903998
10 195 196.2105263 0.007468376
100 197 196.2105263 0.00317653
12 197 196.2105263 0.00317653
25 198 196.2105263 0.016320307
4 200 196.2105263 0.07318726
18 201 196.2105263 0.116910436
30 203 196.2105263 0.234936187
36 203 196.2105263 0.234936187
21 203 196.2105263 0.234936187
50 204 196.2105263 0.309238762
20 205 196.2105263 0.39373447
8 207 196.2105263 0.593305286
3 209 196.2105263 0.833648633
15 210 196.2105263 0.969110007
28 214 196.2105263 1.612886831
13 217 196.2105263 2.202747346
1 217 196.2105263 2.202747346
29 217 196.2105263 2.202747346
17 222 196.2105263 3.389710865
7 223 196.2105263 3.657682968
5 224 196.2105263 3.935848204
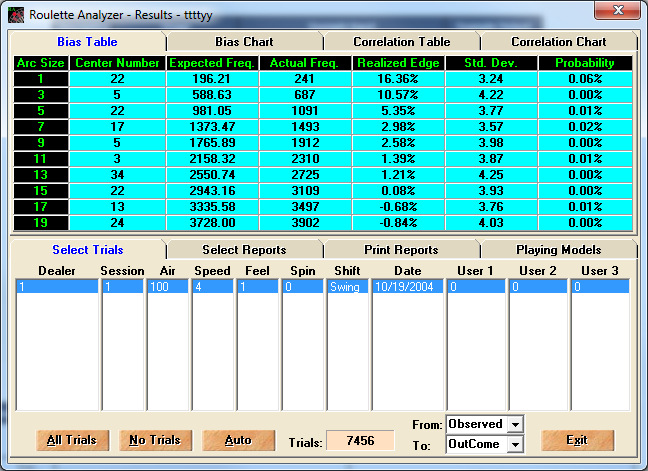
22 241 196.2105263 10.22420657
7456 68.10193133
Note: This is a double zero wheel. 100 = 00 and 50 = 0
The critical value appears to suggest that if your hypothesis is that the wheel is fair then you would reject this hypothesis.
1: If you accept this data then how would you use this data similar to other players who have attempted these methods for taking advantage of wheel bias.
2: What other tests should be performed to prove or disprove any suggested bias.
Thanks
I plotted count on a simple excel line chart.It screamed bias.Quote: BnittyAs many of you know, there is much debate about wheel bias and detection systems.
I am hoping that this thread can help me separate fact from fiction.
Here is what I have:
7500 Data Points on an automated Wheel.
Number Occurrences Expected Value X2
19 163 196.2105263 5.621202281
35 163 196.2105263 5.621202281
16 164 196.2105263 5.287779535
33 171 196.2105263 3.239228033
27 173 196.2105263 2.745665801
9 175 196.2105263 2.292876101
24 176 196.2105263 2.081770951
26 177 196.2105263 1.880858934
14 177 196.2105263 1.880858934
31 180 196.2105263 1.339281681
11 181 196.2105263 1.179142196
32 184 196.2105263 0.759882539
6 186 196.2105263 0.531341766
23 191 196.2105263 0.138369663
34 194 196.2105263 0.024903998
2 194 196.2105263 0.024903998
10 195 196.2105263 0.007468376
100 197 196.2105263 0.00317653
12 197 196.2105263 0.00317653
25 198 196.2105263 0.016320307
4 200 196.2105263 0.07318726
18 201 196.2105263 0.116910436
30 203 196.2105263 0.234936187
36 203 196.2105263 0.234936187
21 203 196.2105263 0.234936187
50 204 196.2105263 0.309238762
20 205 196.2105263 0.39373447
8 207 196.2105263 0.593305286
3 209 196.2105263 0.833648633
15 210 196.2105263 0.969110007
28 214 196.2105263 1.612886831
13 217 196.2105263 2.202747346
1 217 196.2105263 2.202747346
29 217 196.2105263 2.202747346
17 222 196.2105263 3.389710865
7 223 196.2105263 3.657682968
5 224 196.2105263 3.935848204
22 241 196.2105263 10.22420657
7456 68.10193133
Note: This is a double zero wheel. 100 = 00 and 50 = 0
The critical value appears to suggest that if your hypothesis is that the wheel is fair then you would reject this hypothesis.
1: If you accept this data then how would you use this data similar to other players who have attempted these methods for taking advantage of wheel bias.
2: What other tests should be performed to prove or disprove any suggested bias.
Thanks
Then I realised the counts had been sorted so it stopped screaming.
Armed with map of the wheel, I sorted by number position.
Got the rather subjective conclusion that the numbers near 5 and 22 were 'hotter' than those diametrically opposite.
If I were analysing this properly, I'd start by separating clockwise and anticlockwise spins.
In my case this wheel always spins clockwise but the speed varies on a pattern that I can't quite figure out.
Let's say that we can get 10-15k data points for this wheel.
Are we looking to flat bet the biased sectors or are we waiting for some mathematical inference that betting a certain number of times is profitable.
I assume that one could run a simulation on the presented data and try to optimize a strategy?
Quote: RomesSo long as you have a sufficient sampling size, AND IDENTIFYING MARKS (so you're sure the wheel has not ever been changed out during your trials), then the minimum number of trials to identify a bias is usually around 7500-8000.
I have to admit this issue of adequate sample size is something that has been bugging me for several months, ever since I read Stanford Wong's book "On Dice". He seemed to be saying with carefully constructed tests, even a hundred data points would suffice. Granted, that was for dice rather than roulette, but it still seems a small number. It got me curious enough that even tho I hated statistics in college (my least favorite math course) I've started trying to learn more on the subject. From what I can grok, the greater the bias, the smaller the sample size required to generate a P-value that is sufficient to reject the null hypothesis. Sounds reasonable but until you sample a ton of data, how do you know if it is a biased wheel? The 7000 number FEELS right but is there any formula that can be used to figure out what a reasonable sample size should be in a given situation?
The problem is separating fact from EMOTION.Quote: BnittyI am hoping that this thread can help me separate fact from fiction.
People WANT a biased wheel that they can walk up to and get rich with despite the fact that all the people who have been playing there do not see any bias, all the people working there do not see any bias, all the computers owned by the casino do not see any bias, all the managerial reporting programs from accounting do not see any bias.... but lo and behold when THEY walk up to the roulette wheel they will somehow detect and exploit that bias which only they themselves can see. And during that period of exploitation ain't nobody gonna adjust the thermostat or use a vacuum cleaner or nudge the wheel or even give it a good hard stare.
Data Points? Heck, if you really want to believe in something you don't need any datapoints at all. If the pornslapper's photocard says "Not An Agency" you can choose to believe it. If you want the wheel to be biased you can believe it. You don't need data points to feed a fantasy.
If you think the wheel is biased start betting octants, if your bank roll dwindles, it ain't biased.
I haven't gone through the numbers posted above on this roulette wheel, but I saw someone post a 15% or 8% edge looking post. If that's the case, I'd go ahead and bet those numbers for a reasonable amount, such that if I'm wrong and there is no bias, I'm not giving up too much value, but if I'm right, then I'm still getting a fair amount of value. In doing this, I'd continue to track the numbers to verify or refute(?) the previous notion/data that the wheel is biased.
IOW: I just flipped a coin that landed on 15 heads and 5 tails. I think it very well might be biased. Instead of betting large amounts on heads, I'm going to bet a reasonable amount on heads AND continue to track it, to make sure heads is still showing up far more than 50/50. If it continues, then I'll continue. If it doesn't continue, then I'll do the math again and assume the probability is 15/20 then see how unlikely the new results are.
Only 1 in 1,675 chance this result just happens to be out there by luck.
There is no magic number for sample size. If this bias is true and you did 20,000 spins you could just state the same result with more confidence. But 99.94 % confidence (1674/1675) is pretty good...I would be betting heavily on number 22. Have to keep in mind though that single number bets are very high variance, so even with a huge 16.4% advantage, there's still over a 25% chance you will have lost money after 500 bets. So you might need a few days of playing to successfully exploit this.
The sample size needed to give confidence is going to vary based on how biased the wheel is and what kind of bet you're testing for. Testing a single number on a slightly biased wheel will take many more samples than testing a quadrant on a very biased wheel.
By the way the "quadrant" of the ten numbers 17-5-22-34-15-3-24-36-13-1 is even more biased than number 22. It comes up 2,113 times vs expected 1,962. That's 3.97 deviations out, and there�s only a 1 in 27,651 chance of that happening by chance alone.
Can I ask what made you decide to track this specific wheel?Quote: BnittyAs many of you know, there is much debate about wheel bias and detection systems.
I am hoping that this thread can help me separate fact from fiction.
Here is what I have:
7500 Data Points on an automated Wheel.
Number Occurrences Expected Value X2
19 163 196.2105263 5.621202281
35 163 196.2105263 5.621202281
16 164 196.2105263 5.287779535
33 171 196.2105263 3.239228033
27 173 196.2105263 2.745665801
9 175 196.2105263 2.292876101
24 176 196.2105263 2.081770951
26 177 196.2105263 1.880858934
14 177 196.2105263 1.880858934
31 180 196.2105263 1.339281681
11 181 196.2105263 1.179142196
32 184 196.2105263 0.759882539
6 186 196.2105263 0.531341766
23 191 196.2105263 0.138369663
34 194 196.2105263 0.024903998
2 194 196.2105263 0.024903998
10 195 196.2105263 0.007468376
100 197 196.2105263 0.00317653
12 197 196.2105263 0.00317653
25 198 196.2105263 0.016320307
4 200 196.2105263 0.07318726
18 201 196.2105263 0.116910436
30 203 196.2105263 0.234936187
36 203 196.2105263 0.234936187
21 203 196.2105263 0.234936187
50 204 196.2105263 0.309238762
20 205 196.2105263 0.39373447
8 207 196.2105263 0.593305286
3 209 196.2105263 0.833648633
15 210 196.2105263 0.969110007
28 214 196.2105263 1.612886831
13 217 196.2105263 2.202747346
1 217 196.2105263 2.202747346
29 217 196.2105263 2.202747346
17 222 196.2105263 3.389710865
7 223 196.2105263 3.657682968
5 224 196.2105263 3.935848204
22 241 196.2105263 10.22420657
7456 68.10193133
Note: This is a double zero wheel. 100 = 00 and 50 = 0
The critical value appears to suggest that if your hypothesis is that the wheel is fair then you would reject this hypothesis.
1: If you accept this data then how would you use this data similar to other players who have attempted these methods for taking advantage of wheel bias.
2: What other tests should be performed to prove or disprove any suggested bias.
Thanks
Kelly betting time.Quote: BnittyAre we looking to flat bet the biased sectors <snip>
This was discussed in a 1982 math paper by SN Ethier
Testing for Favorable Numbers on a Roulette Wheel
and updated math article in his recent book
The Doctrine of Chances: Probabilistic Aspects of Gambling, 2010. Springer.
13.2 Biased Wheels
page 469
"The question of how to detect and exploit biased
roulette wheels is an interesting one that we attempt to address in this section."
page 472
"Using r = 37 or r = 38 gives a test for determining whether the wheel
is biased, based on the frequency of the most frequent number. Actually,
we are not concerned simply with whether the wheel is biased. The relevant
question is whether there is a favorable number, that is, one that results in
a superfair bet;..."
"For an example, let us return to the question raised at the beginning of
this section. Suppose we have clocked a roulette wheel for n coups, and the
most frequent number has occurred a proportion q > 1/36 of the time. Given
that we want a 100(1 − α)% level of confidence that one or more favorable
numbers exist,..."
"A more subtle question than whether to bet is how to bet. When the probabilities
of the various numbers are known (an admittedly unlikely scenario),
we have seen in Section 10.2 that one should use the Kelly system."
good reading
do have fun
Sally
Here or very crooked wheel, or it's controlled of casino : )
No, I would feel no guilt whatsoever. I sure would not expect any reward for snitching. Playing on a wheel that is sufficiently biased IS reporting it to the casino as someone is sure to notice you are winning too often.Quote: EdpokernutWould anyone here feel "guilty" for taking advantage of a biased wheel? Or would you inform the casino and hope they give you some type of reward? What would the Wizard do?
PS: Mustang Sally .... nice to "see" you again. I've missed your math and explanatory skills.
I started this as part of a graduate level statistics project. I originally thought there was a repeat bias but the numbers show that this is not true. I didn't go in looking for bias but was hoping the numbers would prove otherwise which would effectively end the project.
Now we're getting to the good stuff.
I'm going to take a stab at the Kelly betting and hopefully get back with some positive results.
If anyone else has practical advice, please keep it coming.
ROFLMAO.Quote: EdpokernutWould anyone here feel "guilty" for taking advantage of a biased wheel? Or would you inform the casino and hope they give you some type of reward? What would the Wizard do?
Can't speak for Wizard, but I could live with the guilt, so long as they keep bringing me free coffee.,
to my calculations numbers with a positive EV, Nr / EV
3 +0,9%
15 +1,4%
28 +3,3%
13 +4,8%
1 +4,8%
29 +4,8%
17 +7,2%
7 +7,7%
5 +8,2%
22 +16,4%
If You ask how to play? If you play a flat bet on all numbers (10 numbers), in this case then the total bet amount should be about 5% of the bankroll
for example, if you put in each number for 1 dollar the amount of bets for a spin of $ 10, your bankroll should be about 200 dollars. Are you sure of the correctness of statistics? If you play with big bets you would have to collect 10K-20K spins
50 = 0
Im sure about the Chi Square value and the occurrences. What I cannot know is how or when the maintenance occurs on this wheel.
I don't have a strategy right now but several people have proposed what theoretically could work if this bias is still active.
I'm only getting 60 spins/hr so this one will take some time to fully investigate.
Sorry, perhaps I missed something.Quote: BnittyThanks for the replies everyone.
I started this as part of a graduate level statistics project. I originally thought there was a repeat bias but the numbers show that this is not true. I didn't go in looking for bias but was hoping the numbers would prove otherwise which would effectively end the project.
Now we're getting to the good stuff.
I'm going to take a stab at the Kelly betting and hopefully get back with some positive results.
If anyone else has practical advice, please keep it coming.
Again, why did you choose this paticular wheel to track?
Was it the first wheel you tracked?
Was it just the most convenient wheel to your location?
I would find it odd if someone just happened to find a bias on the first wheel they decided to track.
If there's a real bias on the first most convenient wheel you tacked, that would lead me to believe a good many other wheels made by the same company are biased.
Quote: BnittyIm sure about the Chi Square value and the occurrences. What I cannot know is how or when the maintenance occurs on this wheel.
I don't have a strategy right now but several people have proposed what theoretically could work if this bias is still active.
I'm only getting 60 spins/hr so this one will take some time to fully investigate.
Seems like you need a way to confirm the bias still exists but with a much smaller sample size than the one you used to detect the bias. Ideally you could confirm the bias in an hour of observation (i.e, with 60 spins) Maybe you could have a new Chi-Sq test where null hypothesis is that the wheel still has the same bias and you then accept a much higher than normal Type-I error? At least you would be erring on the side of caution. You could focus on 1 number (e.g., the 22) which would drop the DF way low which I believe also reduces sample size.
I have data from last week of mutiple small sessions tracked.
Can you explain how you would testing a smaller
sample size can prove or disprove what the larger sample size suggests?
And even if its a poorly run casino, some nudge, some janitor, something will change the physics involved.Quote: QFITIf it's a well run casino, by the time you obtain enough of a sample, they'll rotate the pocket rings and/or heads.
Anyone consider the use of two people trying to record the wheel's history and compare the "bias" statistics and the errors involved in just recording the results?
Quote: RSWhat actually causes a wheel to be biased? I understand things can cause a bias, but don't understand how. IE: If it's not level, would that cause bias? If so, why?
If the metal divider between 2 numbers gets a bit loose and has a little more give to it, it creates a situation where the ball is less likely to bounce out of those 2 numbers.
If the bias seems to be a section of say 7 numbers or more I�d say that�s an unbalanced wheel
Nothing creates a bias. Bias is always there for us to try to further eliminate. A tiny tilt might lead to more bias.Quote: QFITThe UK equivalent of the US Bureau of Weights and Measures once tested Roulette wheels and discovered that an absurdly tiny tilt in the wheel creates a bias.
This test does not consider the order of the numbers on the wheel. For that, to do just an eyeball test, here is a graph showing the number of occurrences by number, in the order on the wheel.

Note how the four most frequent numbers, 17, 7, 5, and 22, are all within a six number arc on the wheel.
Unfortunately, to the best of my knowledge, there is no statistical test that considers order.
Between the chi-squared test and eyeball test, I think the wheel is a little unbalanced but not sure if its enough to overcome the house edge. Also, as QFIT mentioned, most casinos know to rotate the wheels among the tables on a regular basis.
Quote: Wizard. Also, as QFIT mentioned, most casinos know to rotate the wheels among the tables on a regular basis.
I believe the OP said this was an automated wheel. I assume that is hooked up to multiple betting stations. I would not expect someone to closely monitor those as there is probably not a live dealer involved. IF I was the OP I would be playing this until I believe they fixed it.
What would an experiment to determine if the bias is enough to beat the house edge?
I've segmented the data to try to figure out if the bias has always been present. There is evidence that the bias was more prevalent in the first 2000 spins and is less prevent in the last 5000+ spins.
As several have noted, they know way more than I do and are surely not in the business of being unprepared.
It would likely take a very long time to prove that this wheel could be exploited and is likely more likely that it cannot be exploited because of rotation or retirement of a questionable wheel.
Thanks in advance for any guidance on the matter.
I was going to map the number spun up on each table. Due to elimination I found 4 tables that never got closedown, it was eight actually, but for convenience and cover I used 4 that I could sit and record discretely from cover of slots machine. I was actually warned off because initially I would walk around with a book and enter the number per table etc. the suits told me I was doing an illegal activity etc.
I said thanks etc I won�t do it again , wait for next shift and start again after a few extra days I was warned again, hence sitting in slots next to tables etc. Don�t make a song and dance about it be more discrete.
These tables are never clean ( then) I would check to see if by eyeball anything had changed , same bit of lint in red 30 etc then I would start recording I did this 4days a week for six weeks, I split my shift on Friday and Saturday to exclude night spins as the rate decline dramatically I aimed to get 250spins per table per day, minimum , usually more . This is before the keep on spin rules we have here now, then it was no bet no spin. A table could be dormant for hours. Now they spin every 30seconds regardless of a bet placed or not.
Ok I got through those hoops, I would crunch the numbers looking for a bias, after the six or so weeks I did find two tables showing a bias, three number had been spun at a higher percentage than all other on the two tables, the other table had four, the fourth table had six but that table didn�t have a large enough gap to other numbers spun. The three numbers formed a triangle on the wheel
I set off to play one table as the other table I cannot play at same time due to location, on the day I would record 60 spins prior to placing a bets.Yes I am aware that each spin is independent to the last , I�m observing possible bias indications. If it was in reasonable number of bias number been spun beforehand I would start betting on just those 3 numbers ( the ones from tabulated spins) nothing else. $ 600 bankroll $5 per number. I made money.
After about two weeks I thought I�d employ a couple of lost souls that float around casino to take down numbers from other tables after a few days I stopped that as I realised they where just writing numbers before they meet up with me to get paid , I�m always early , punctual , and observant.
After about a month, I also employed a friend of mine who had just left his job , he would get $600 bankroll sit at other table and bet those three numbers for that table. He would receive 50% of any profit and have no personal outlay. Sweet ride in my mind . Whatever.
That went well for about 5 days, then I was not making a profit on his table, as I can see the screen he�s working and the biased numbers are hitting I had to ask why. His reply was as no number had hit in twenty spins , so he thought he�d try his own and lost the bankroll, I didn�t ask him back the next day. I just ran the one table at a time, had a nice income for a couple of more months, the casino re configured the table placement but didn�t level the tables as per usual.
They refurbished the whole floor and changed the wheels and earlier this year they ground an extra 1mm off the little barrier between numbers.
These tables still display a bias, they have two wheels on tv spun by live dealer and can be accessed via terminals throughout the casino 24/7 so you can map to your hearts desire, when they moved the two tv wheels to the main �stadium�� I watched them from interest and was amused to see them just put the wheels in new housing and start spinning up numbers, time is money.
My thoughts on bias tables is this if you find one and are prepared to map tables until you find one , play until it�s no longer shows a bias.
Yes the math says you will loose at roulette, I agree, but you can loose less if you find a table bias, cheating no , exploiting an anomaly on rare occasion yes. To a casual observer with no due diligence the table bias cannot be ascertained and quiet frankly most of you would not have the patience , or perhaps the inclination, to gather the raw numbers. Doing a simulation is one thing, but finding a bias is another. The sample size I used initially was about 3500spins per table approximately at the time I decided it was enough before I went live. I had thought perhaps I�m wasting my time as at any point in time the bias could be
a) corrected level wheel, clean debris away, oil and grease ( some wheels actually made noises)
b) be non existent
c ) be corrected in the hour or so before I went live, if that�s the case how would I know if I left the database extend to 5000spins, if I would have made money or not.
You have to go live at some stage. I had updated the data as I went over the years ( each table has a specific casino designated number But I must concede that I haven�t been able to identify a designated number for the actual wheel ) Yes some particular wheels would stop showing a bias, for whatever reason listed above or below in this post. I think they change the wheels to othe table sometimes, no big deal nothing to get hung up over. I currently monitor the two tv live roulette wheel at the private terminals 24/7 operations plus drink service, I only drink tea or coffee while working. I make money.
Shoot I could just spew ,
I really wish we had video poker here, now I can see how you people use strategy to win , farrrkk what an extra income stream. You know couple hours here couple hours there you can make money at a casino if you know how.
Bias can be caused by failure to clean and maintain equipment, not following proper installation procedures and possibly defective materials used in the initial manufacturers process. I�m sorry but this may upset a few people and I don�t give a rats arrzzz but some Aussie workmanship leaves a lot to be desired, more money in my pocket, thank you lazy bugger, thank you.
As an income stream it is effective until it is not. The machining of separating bar as an example of a recent occurrence here in the last 8 months.
Kind regards.
I'm sure that you don't want to give advice that could be detrimental or cause someone to go down the wrong path.
I understand what you mean by the lack of a standard test but I'm asking for your opinion, based on what has been discussed, as a man of mathematics, what experiment would you do (in theory) to come to
a conclusion (good or bad) about this situation?
Quote: BnittyWizard
I'm sure that you don't want to give advice that could be detrimental or cause someone to go down the wrong path.
I understand what you mean by the lack of a standard test but I'm asking for your opinion, based on what has been discussed, as a man of mathematics, what experiment would you do (in theory) to come to
a conclusion (good or bad) about this situation?
That�s a joke ? Right? So you want an experiment to determine a bias, but you would have to load data with a bias built into the sim to see it there was a bias, I see why the dog runs in circles to catch its own tail . I just will pretend I haven�t load instructions in the program for a bias , oh surprise there seems to be an anomaly here.
Do you also have to load the program with a an event in a certain number of spins to qualify that the bias has now been rectified and now the bias is now no longer influences the next RNG. I see why the dog chased its own tail, cruel me had him desexed .
Nobody knows if that particular wheel you�re looking at is has a bias or not, if you think there is a bias you map it , if you want to map a wheel for a million spins , 20000 spins whatever it takes to keep you from putting a loosing bet down, do it, it may have the bias rectified at ANYTIME. Depending on how much time of your life you want to waste
If you just want an idea to be intellectualised then just ponder on that your self. I�m told strawberry yoghurt works a treat not as hard to clean up as opposed to honey or ice cream
Yes you can think about getting hit by a bus and I believe the stats are higher than a plane crash, and walking is cheaper, but if you never walk across the road you never actually put your thought to the test. No I�m not suggesting you have a bus accident.
This is really a moot point because roulette can never be beaten, so way waste space writing about some abstract fantasy? You can profit from a wheel, a particular wheel , not all wheels will display a significant bias or potential bias. You can only profit from that found particular wheel ( with due diligence) until the bias is no longer a bias. You will not be find a magic formula for finding a bias table, how long a bias will or will not last, it�s really a window of opportunity or not .You only get hit by the bus when you get hit. Nearly, could have is not the same as I have been hit by a bus.
Really simple in the long term you lose. It�s roulette , riddle me this. Riddle me that.
There�s better experiments that would be much more fulfilling to your fellow human being to benefit from. I�m sure my dog would love to get his testiculars back now that would be a wonderful experiment the dog would enjoy. You know, no more running in circles.
Kind regards , it�s Christmas season cheers.
Quote: BnittyWizard
What would an experiment to determine if the bias is enough to beat the house edge?
I've segmented the data to try to figure out if the bias has always been present. There is evidence that the bias was more prevalent in the first 2000 spins and is less prevent in the last 5000+ spins.
As several have noted, they know way more than I do and are surely not in the business of being unprepared.
It would likely take a very long time to prove that this wheel could be exploited and is likely more likely that it cannot be exploited because of rotation or retirement of a questionable wheel.
Thanks in advance for any guidance on the matter.
If bias is no longer present or has changed then that particular wheel has been recalibrated due to its maintenance schedule. End of bias for that wheel for now. Simple , no need for an experiment . You cannot over come the house edge in the long term. The bias was there , then it was not.
Kind regards.
Quote: BnittyWizard
I'm sure that you don't want to give advice that could be detrimental or cause someone to go down the wrong path.
I understand what you mean by the lack of a standard test but I'm asking for your opinion, based on what has been discussed, as a man of mathematics, what experiment would you do (in theory) to come to
a conclusion (good or bad) about this situation?
I would look into the Kolmogorov�Smirnov test. Based on what I've seen, the data looks fishy. I think if there is an edge, its a small one. I know this isn't very concrete but its about the best I can do for free. You might reach out to CrystalMath on the forum about this as well.
Quote: WizardI would look into the Kolmogorov�Smirnov test. Based on what I've seen, the data looks fishy. I think if there is an edge, its a small one. I know this isn't very concrete but its about the best I can do for free. You might reach out to CrystalMath on the forum about this as well.
I thought the K-S test was only applicable to continuous variables and for non-continuous you used Chi Square for 'goodness of fit". Am I missing some aspect of the problem that allows the use of K-S?
I will take a look at the K-S test. Based on your experience do you think there is a mistake made in the data somewhere?
If you think there is something that doesn't make sense, please let me know your thoughts and I can revisit the raw data.
Addressing the point of other posts, investigating the data only to find that more data is needed to confirm something that probably doesn't exist anymore is a likely scenario.
Thanks for advice and suggestions.
Quote: TumblingBonesI thought the K-S test was only applicable to continuous variables and for non-continuous you used Chi Square for 'goodness of fit". Am I missing some aspect of the problem that allows the use of K-S?
Good point. You're right. However, couldn't we assume a straight line for the expected function? Keep in mind we are not looking for perfection here but whatever suits the situation best.
CrystalMath, what's your opinion?
Quote: BnittyI will take a look at the K-S test. Based on your experience do you think there is a mistake made in the data somewhere?
You would know better than me the reliability of this particular data. I see no reason to suspect its wrong.
Quote:Addressing the point of other posts, investigating the data only to find that more data is needed to confirm something that probably doesn't exist anymore is a likely scenario.
That is the safe answer. I'm showing a 5.35% player advantage on the 5-number arc around number 22. Of course, might just be due to randomness. If you're going to collect data, consider betting small to medium on that arc.
How long did it take for you to track 7k spins? If the bias existed the entire time it took for you to tack the 7k spins, what makes you think it will be changed?Quote: BnittyWizard
I will take a look at the K-S test. Based on your experience do you think there is a mistake made in the data somewhere?
If you think there is something that doesn't make sense, please let me know your thoughts and I can revisit the raw data.
Addressing the point of other posts, investigating the data only to find that more data is needed to confirm something that probably doesn't exist anymore is a likely scenario.
Thanks for advice and suggestions.
Quote: WizardI'm showing a 5.35% player advantage on the 5-number arc around number 22. Of course, might just be due to randomness. If you're going to collect data, consider betting small to medium on that arc.
Yes, 5.35% for 5 wide arc around 22. Now, if we had the order, we could look at the first half vs. the second half.
Quote: QFITYes, 5.35% for 5 wide arc around 22. Now, if we had the order, we could look at the first half vs. the second half.
Your wish is my command.
| Number | Count |
|---|---|
| 0 | 204 |
| 28 | 214 |
| 9 | 175 |
| 26 | 177 |
| 30 | 203 |
| 11 | 181 |
| 7 | 223 |
| 20 | 205 |
| 32 | 184 |
| 17 | 222 |
| 5 | 224 |
| 22 | 241 |
| 34 | 194 |
| 15 | 210 |
| 3 | 209 |
| 24 | 176 |
| 36 | 203 |
| 13 | 217 |
| 1 | 217 |
| 00 | 197 |
| 27 | 173 |
| 10 | 195 |
| 25 | 198 |
| 29 | 217 |
| 12 | 197 |
| 8 | 207 |
| 19 | 163 |
| 31 | 180 |
| 18 | 201 |
| 6 | 186 |
| 21 | 203 |
| 33 | 171 |
| 16 | 164 |
| 4 | 200 |
| 23 | 191 |
| 35 | 163 |
| 14 | 177 |
| 2 | 194 |
I'm talking about the order of the 7,000+ rolls.
Quote: QFITI'm talking about the order of the 7,000+ rolls.
I knew that was too easy.
I do have the relative order of each spin during each session during the time period which consists of about 70 sessions of 60 - 200 spins per session.
I segmented the data into seven (plus) 1000 spin increments and the bias that exists in the arc mentioned appears (mostly) to be concentrated in the first 2000 spins.
Any suggestions on further scrutiny into the data is welcomed.
Can you explain what you mean by that?Quote: WizardBased on what I've seen, the data looks fishy.
I took it to mean the data could be made up or something like that.