BasilTheBorder
BasilTheBorder
  • Threads: 1
  • Posts: 3
Joined: Feb 3, 2023
Thanked by
Dieter
February 3rd, 2023 at 6:44:20 AM permalink
If there is an event occurring, say 1 in 100 times for ease of use, how do I determine the chance of the gap between events happening? So basically a "games since last event" counter. How many times would you expect it to occur on successive games? How many with exactly a 1 game gap? How many with exactly a 2 game gap ? How many with a 1000 game gap? etc., I'm thinking an infinite number of samples, rather than a small set. Is there a statistical formula to use? Any ideas very much welcomed.
pwcrabb
pwcrabb
  • Threads: 4
  • Posts: 185
Joined: May 15, 2010
February 3rd, 2023 at 8:56:50 AM permalink
Probability of event is (1/100)
Probability of non-event is therefore (99/100)

P(gap size zero) is therefore [ (99/100)^0 ] (1/100)

P(gap size one) is therefore [ (99/100)^1 ] (1/100)

P(gap size nineteen) is therefore [ (99/100)^19 ] (1/100)

Sum of all probabilities of gaps from zero to infinity is 1
Obtained by infinite series summation


(Edited 7:23 pm PST 03 Feb)
Last edited by: pwcrabb on Feb 3, 2023
"I suppose I was mad. Every great genius is mad upon the subject in which he is greatest. The unsuccessful madman is disgraced and called a lunatic." Fitz-James O'Brien, The Diamond Lens (1858)
BasilTheBorder
BasilTheBorder
  • Threads: 1
  • Posts: 3
Joined: Feb 3, 2023
February 3rd, 2023 at 9:15:52 AM permalink
Thanks. I was heading in that direction but had been diverted by Poisson theory which was a bit of a red herring!
pwcrabb
pwcrabb
  • Threads: 4
  • Posts: 185
Joined: May 15, 2010
February 3rd, 2023 at 9:31:12 AM permalink
Yes, Poisson is very useful in other circumstances but not here.
"I suppose I was mad. Every great genius is mad upon the subject in which he is greatest. The unsuccessful madman is disgraced and called a lunatic." Fitz-James O'Brien, The Diamond Lens (1858)
Mental
Mental 
  • Threads: 13
  • Posts: 1236
Joined: Dec 10, 2018
February 3rd, 2023 at 3:02:46 PM permalink
Quote: pwcrabb

Probability of event is (1/100)
Probability of non-event is therefore (99/100)

P(gap size one) is therefore [ (99/100)^1 ] (1/100)

P(gap size nineteen) is therefore [ (99/100)^19 ] (1/100)

Sum of all probabilities of gaps from zero to infinity is 1
Obtained by infinite series summation
link to original post

I was understanding the OP's question differently.

You say the P(1) = [ (99/100)^1 ] (1/100). This is the probability of one miss before a hit when you are starting at a hit.

In an infinite sequence, the hits come only once in 100 games. The probability of seeing a sequence of back to back hits starting at any particular game is 1 in 10,000. A sequence with two hits separated by exactly one miss appears with a probability 0.000099, etc.

Perhaps the OP can clarify which number he is seeking.
Quote: BasilTheBorder

If there is an event occurring, say 1 in 100 times for ease of use, how do I determine the chance of the gap between events happening? So basically a "games since last event" counter. How many times would you expect it to occur on successive games? How many with exactly a 1 game gap? How many with exactly a 2 game gap ? How many with a 1000 game gap? etc., I'm thinking an infinite number of samples, rather than a small set. Is there a statistical formula to use? Any ideas very much welcomed.
link to original post

"how do I determine the chance of the gap between events happening?" leads me to believe it was my interpretation.
This forum is more enjoyable after I learned how to use the 'Block this user' button.
charliepatrick
charliepatrick
  • Threads: 39
  • Posts: 2946
Joined: Jun 17, 2011
February 3rd, 2023 at 4:29:24 PM permalink
If you start out afresh and ask what are the chances of an event with pr=1/100 happening on the 1st, 2nd etc. attempt; then the answer is 1st = 1/100, 2nd = 99/100 * 1/100 etc. This gives a distribution of "gaps" which just gradually decreases as the gap gets larger.

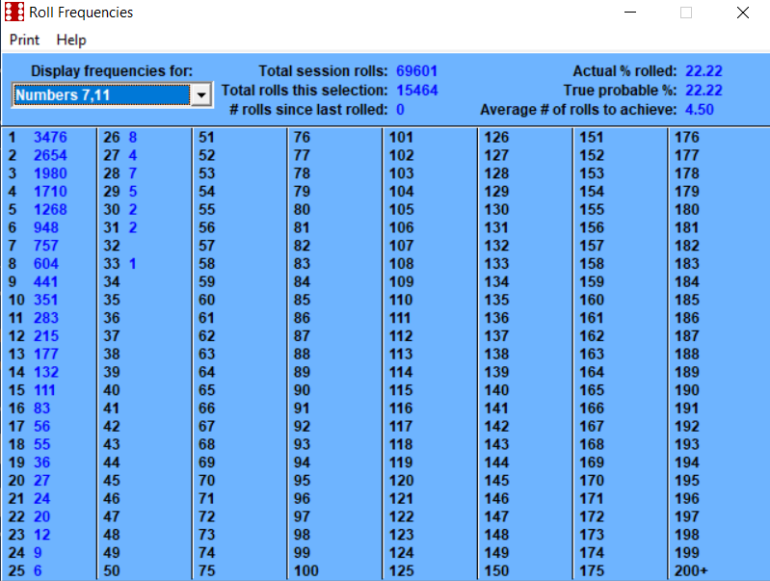
By pure coincidence there's a similar discussion using craps dice asking how often would it take to throw a "2" (1-1) and then mentions other totals including a "Natural Winnerl" (7 or 11). The enclosed picture (I hope ChumpChange doesn't mind me copying it here) shows how the frequencies decrease. In this case there are 8 ways out of 36 to throw a "Natural Winner". I've since replied by comparing this to an example of a long road where some of the buildings are pubs and the rest private houses, asking how far is it to the next pub. https://wizardofvegas.com/forum/gambling/craps/37930-roll-frequencies-after-69-6k-rolls-on-wincraps/#post880610
Quote: ChumpChange

link to original post

ChumpChange
ChumpChange
  • Threads: 111
  • Posts: 4738
Joined: Jun 15, 2018
February 3rd, 2023 at 4:57:15 PM permalink
I started my thread after reading the OP's post of this thread. It wasn't quite coincidence, but I didn't want to clog up the OP's thread. The replies here are beyond my typical math abilities.
Mental
Mental 
  • Threads: 13
  • Posts: 1236
Joined: Dec 10, 2018
February 3rd, 2023 at 6:26:15 PM permalink
Quote: charliepatrick

If you start out afresh and ask what are the chances of an event with pr=1/100 happening on the 1st, 2nd etc. attempt; then the answer is 1st = 1/100, 2nd = 99/100 * 1/100 etc. This gives a distribution of "gaps" which just gradually decreases as the gap gets larger.

OP specifically asked about "gap between events" but maybe OP meant gaps before the first event. These two are certainly not the same question.
This forum is more enjoyable after I learned how to use the 'Block this user' button.
pwcrabb
pwcrabb
  • Threads: 4
  • Posts: 185
Joined: May 15, 2010
February 3rd, 2023 at 7:07:58 PM permalink
CharliePatrick and I do not disagree. His pub scenario can be modeled similarly to Basil's scenario, except with differing probabilities for P(success) and P(failure). Mental requests from Basil a clarification and a specific problem, and I agree. Precise problem specification is essential.

Basil, are you analyzing for:
1. The probability of first success on exactly a specific future trial?
2. The cumulative probability of first success on or before a specific future trial?
3. The expected number of gaps, or consecutive failures, of a certain size within a large universe of experiments?
4. The expected size of the next gap?
5. The mean size of all gaps?
6. Something else?
Last edited by: pwcrabb on Feb 3, 2023
"I suppose I was mad. Every great genius is mad upon the subject in which he is greatest. The unsuccessful madman is disgraced and called a lunatic." Fitz-James O'Brien, The Diamond Lens (1858)
BasilTheBorder
BasilTheBorder
  • Threads: 1
  • Posts: 3
Joined: Feb 3, 2023
February 4th, 2023 at 1:38:59 AM permalink
What I am interested in is the profile of gaps between successful events. Disregarding the lead up to the initial event, I think Mental's explanation fits my scenario. I have a slot game in development with a random event occurring 1 in 100 games. Logging the gaps between events gives a similar shaped curve to using Mentals approach. For some reason I was expecting a bell shaped curve centred around the 100 game gap. I need to brush up on my statistical knowledge! So in answer to your question, 6, or possibly 3. The profile of gaps between successful events.
pwcrabb
pwcrabb
  • Threads: 4
  • Posts: 185
Joined: May 15, 2010
February 4th, 2023 at 2:36:35 AM permalink
Now I understand why you were looking at Poisson, because its profile is similar to the distribution that you seek. Excel is all that you need for a decent graph.

For gap sizes (n) from zero to any sufficiently large number to be illustrative, perhaps 500K, do the following:

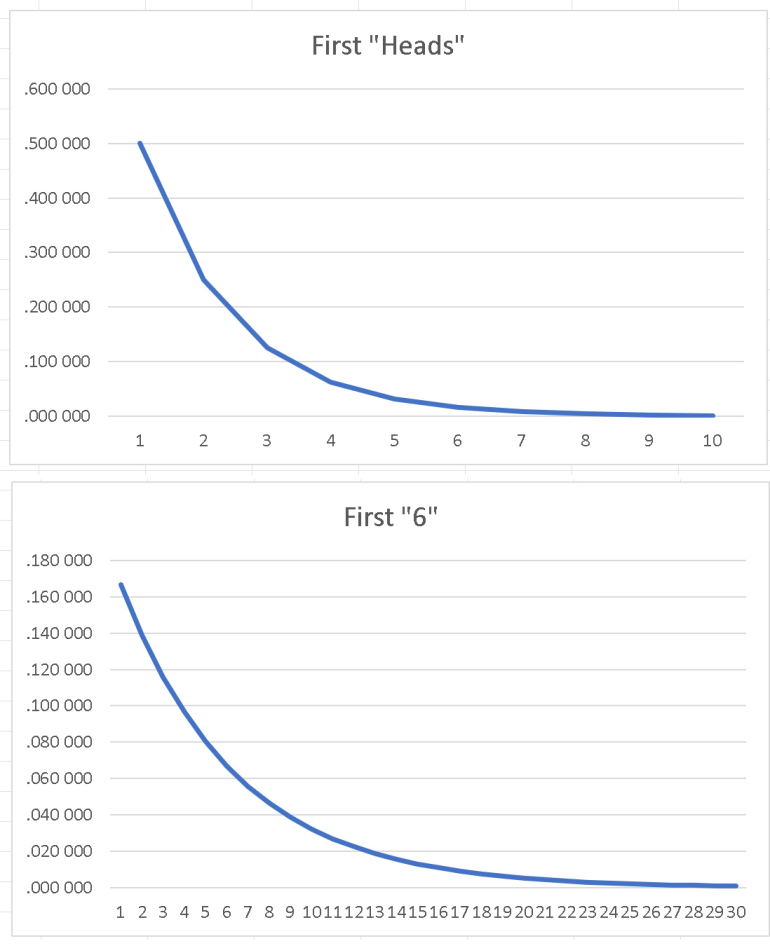
1. Plot [ (99/100)^(n) ] [ (1/100) ]
This graph will be a gently sloped monotonic curve from (1/100) down towards the x axis asymptotically. It will remind you of Poisson.

2. Plot the incremental summation of the above series of terms. This graph will be a gently sloped monotonic curve from (1/100) up towards 1.0 asymptotically. Observe the value of (n) at which the curve exceeds 0.5, which means that likelihood has been achieved.

Please forgive yourself for any predilection for bell curve distributions. All of us have been conditioned to expect them everywhere.
Last edited by: pwcrabb on Feb 4, 2023
"I suppose I was mad. Every great genius is mad upon the subject in which he is greatest. The unsuccessful madman is disgraced and called a lunatic." Fitz-James O'Brien, The Diamond Lens (1858)
Mental
Mental 
  • Threads: 13
  • Posts: 1236
Joined: Dec 10, 2018
February 4th, 2023 at 4:09:07 AM permalink
Quote: BasilTheBorder

What I am interested in is the profile of gaps between successful events. Disregarding the lead up to the initial event, I think Mental's explanation fits my scenario. I have a slot game in development with a random event occurring 1 in 100 games. Logging the gaps between events gives a similar shaped curve to using Mentals approach. For some reason I was expecting a bell shaped curve centered around the 100 game gap. I need to brush up on my statistical knowledge! So in answer to your question, 6, or possibly 3. The profile of gaps between successful events.
link to original post

I confess that I had the thought of the most probable gap being near 1/p for a second. The most probable gap has to be at 0 for the same reason that the most probable regular interval to see the first radioactive decay event is the first period. There are fewer nuclei after the first period ends.

An easier way to think about it is that after every hit, the probability of a gap of length zero,1,2,... is the same as the question pwcrabb answered. The function you seek is pwcrabb'c function divided by p. If p=1, then P(0) =1 and and P(x!=1)=0.

The answer only works for an infinite series. The answer is only approximate for a finite series if you add any initial partial gap to any ending partial gap. You can check this by counting the number strings of (wrapped) consecutive zeros in a sequence of binary digits 0-(2^n). If n=3, 000 001 010 011 100 101 110 111. p=0.5,
P(3) = 1/(8*3)
P(2) = 3/(8*3)
P(1) = 3(8*3)
P(0) = 6/(8*3)
This forum is more enjoyable after I learned how to use the 'Block this user' button.
charliepatrick
charliepatrick
  • Threads: 39
  • Posts: 2946
Joined: Jun 17, 2011
February 4th, 2023 at 4:18:00 AM permalink
In this case the most likely time it will happen is the next roll/spin/toss. To show this easier here are two graphs of tossing coins (waiting for a Head) and rolling a single die. For win on the first toss ("Heads") you need "H". To win on the second toss you need "TH", this series continues "TTH" "TTTH" .... "TT...TTH" ... Thus you can see that you need an increasing number of Tails before the Heads. This is why the probability keeps going down. With other similar events you also need a series of misses before the hit.

In your example there's a 10% chance of getting the feature retriggered within 11 spins, etc.
ChanceSpins
10%
11
20%
23
30%
36
40%
51
50%
69
60%
92
70%
120
80%
161
90%
230
95%
299
98%
390
99%
459
99.5%
528
99.8%
619
99.9%
688
99.99%
917
pwcrabb
pwcrabb
  • Threads: 4
  • Posts: 185
Joined: May 15, 2010
Thanked by
charliepatrick
February 4th, 2023 at 9:58:55 AM permalink
Thank You CharliePatrick for providing two illustrative graphs. Please notice that the second graph is useful for both one number on one die and the total of Seven on two dice. In both dice cases, P(success) is (1/6).

Thank You also for your report of results for the original problem for which P(success) is (1/100). Please notice especially that the cumulative probability reacbes 50% when (n) is 69, which seems correct at first glance. This would be the Median of the distribution.
"I suppose I was mad. Every great genius is mad upon the subject in which he is greatest. The unsuccessful madman is disgraced and called a lunatic." Fitz-James O'Brien, The Diamond Lens (1858)
Ace2
Ace2
  • Threads: 32
  • Posts: 2672
Joined: Oct 2, 2017
February 4th, 2023 at 4:20:05 PM permalink
Another way to get the median of 69 is ln(2) * 100, rounded to nearest integer
It’s all about making that GTA
ThatDonGuy
ThatDonGuy
  • Threads: 117
  • Posts: 6218
Joined: Jun 22, 2011
February 4th, 2023 at 4:53:08 PM permalink
Quote: Ace2

Another way to get the median of 69 is ln(2) * 100, rounded to nearest integer
link to original post


Here is an approximation I get:

Let p be the probability of a particular trial being successful, and c the probability of being successful in n or fewer trials

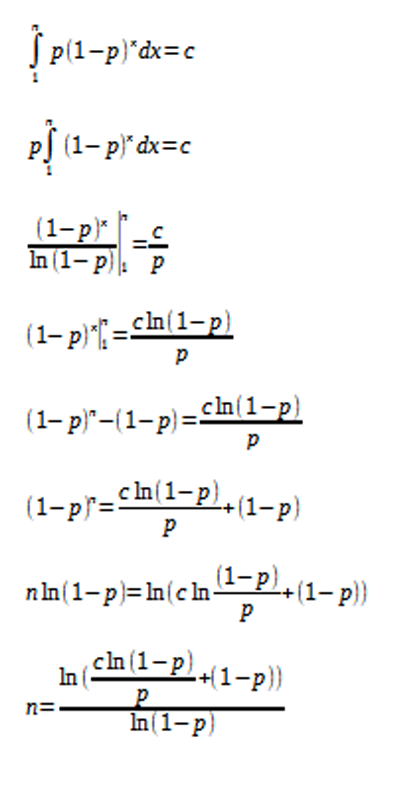
For p = 1/100 and c = 1/2, n = 71.49
Last edited by: ThatDonGuy on Feb 4, 2023
Ace2
Ace2
  • Threads: 32
  • Posts: 2672
Joined: Oct 2, 2017
February 4th, 2023 at 6:40:32 PM permalink
Are you sure the lower bound of the integral shouldn’t be zero? That would yield n=69.47, much closer to the correct figure

I realize success can’t actually happen in less than one trial, but the integral is for continuous time, not individual trials…which isn’t the actual case either. It’s an approximation

Incidentally, I’ve found that integrals of Poisson processes give the correct answer only when integrating over all time (zero to infinity)
Last edited by: Ace2 on Feb 4, 2023
It’s all about making that GTA
pwcrabb
pwcrabb
  • Threads: 4
  • Posts: 185
Joined: May 15, 2010
February 4th, 2023 at 8:05:38 PM permalink
Integrals not required. Merely logarithms. Define the accumulation function including the exponent (n) and set the accumulated value of f(n) at 0.50. At what value of (n) is the statement true? Decimals to any degree of precision.

Monte Carlo simulations are useful for corroborating precise analytical answers. I have read of several gritty practitioners who swear by simulations as close enough for their non-engineering work.
"I suppose I was mad. Every great genius is mad upon the subject in which he is greatest. The unsuccessful madman is disgraced and called a lunatic." Fitz-James O'Brien, The Diamond Lens (1858)
  • Jump to: