
Probability Distribution of VP
Thread Rating:
Now, where I failed is finding an elegant way to calculate the probability distribution for let�s say 800 played hands. I assume the right way is to deal with discrete probabilities of every possible outcome of hand combinations. But that is a huge amount of calculation for getting the probability distribution.
To further clarify my aim I reference to the blog:
--> How to calculate standard deviation for fpdw
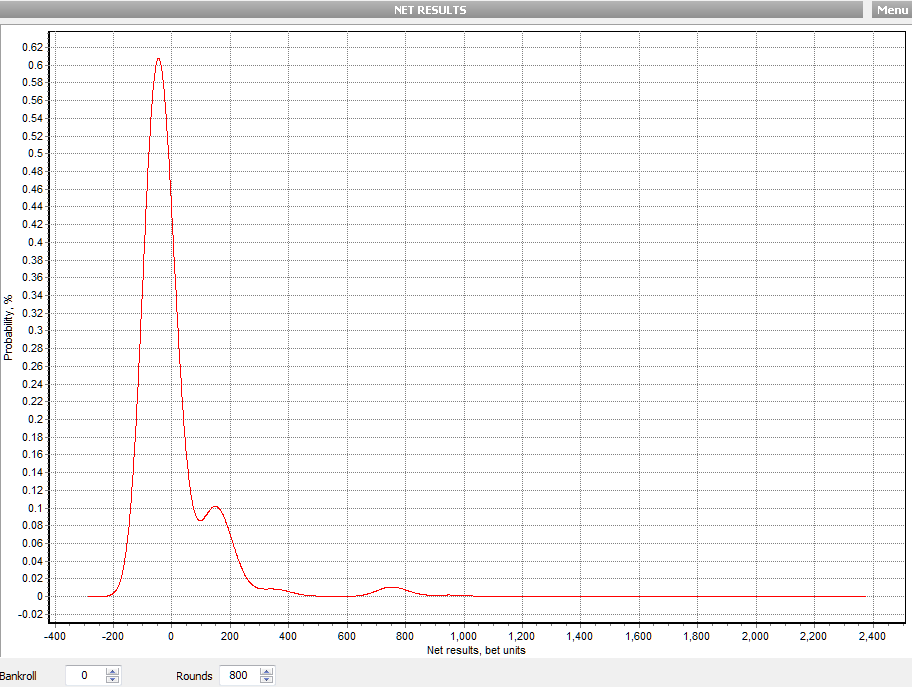
where �mustangsally� showed a probability chart (software �Gambler�s Odds 1.3�) for Net Results. The graph there is calculated for 480 rounds and shows a clear deviation from normal distribution.
This graph I would like to calculate. Can anybody help ?
mpower
The key here is that you don't need to program VP to do this simulation. You simply use the distribution for 1 hand as your model for the game and use a RNG. The std dev is trivial once you have the frequency array. I don't know of any other quick tricks to get this result. Clearly the Central Limit Theorem is not a good choice for small N on games like VP.
Another method would be to use a Markov chain with a transition matrix built from the probability distribution for 1 hand. This seems like a reasonable approach, but I have never used this method. I think MS is a fan of this technique, so maybe she can comment.
the distribution is calculated firstQuote: mpowerThis graph I would like to calculate. Can anybody help ?
mpower
the graph comes after that
one way using a computer is using the math concept of convolution
advanced stuff here
(my husband showed me this once and it made my head hurt so I taked him to bed ands used him to make me feel so much better)
Ahhhh
I use and GO1.3 uses matrix multiplication and computers do these super fast no problem
but one better code the matrix correctly or yucks all around
i know GO1.3 chops off the ends of the matrix as it grows (the gardener in the program)
for 800 hands we could have 799 (units)*800 as high bankroll and -800 as low bankroll for a matrix 640,000 x 640,000
no problem for todays computers to do this (of course RAM matters)
it is what they do
compute!
sure simulation can get close but will produce an error depending on its
sample size (SIZE MATTERS!)
simulations are fun too!
my Q 2 U
why you want to do this, other than it IS so much fun!
Sally
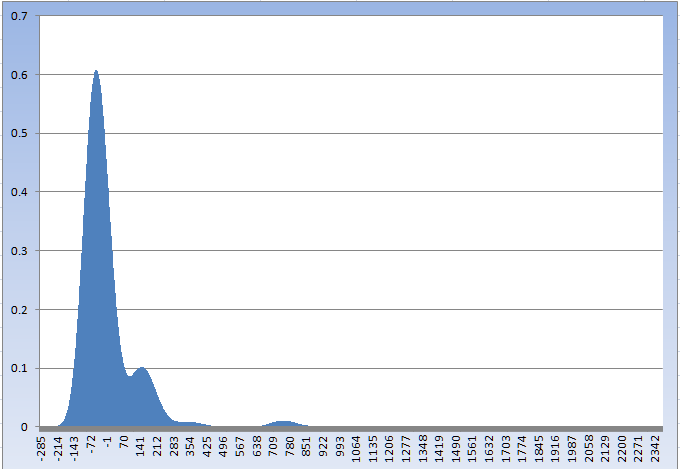
from Excel
great is ok eye guessQuote: surrender88sThanks Sally! The graph is great,
thank you
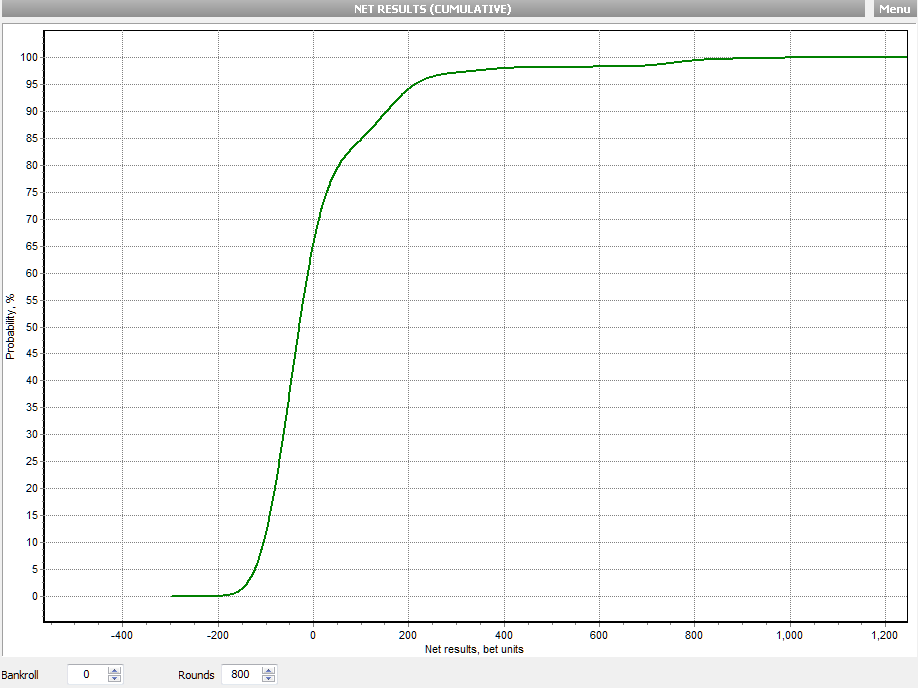
a different view does help out tooQuote: surrender88sbut since it's hard to tell the difference between 0 and some slightly positive non-zero number in the higher ranges, can we get the data in a table?
Like what is the probability of winning 0 to 100 units, 100-500 units, 500-1000 units, and 1000+ units?
the cumulative view (x or less) so about 65% chance of being 0 or less
85% 100 or less so the interval of 0-100 is about 20% by sight
other intervals can be calculated close by sight too
note!
no bankroll was used
in other words
i had (an DUE have) plenty of cold hard cash to make every bet
the distribution data no all fits here
sums to less than 1 due to rounding of course
fpdw-800n-dist.txt
is a file in my online folder find link in me blog if you wish too (2)
Sally
Fun stuff.
@mustangsally: Thank you very much for your data supply on FPDW 800 hands ! And answer to your question: First, it�s fun. Second, I am an advantage gamer (Poker, BJ, VP).
yes, fun stuff for sureQuote: surrender88sLooking at the ends of your initial chart, it looks like your calculations saw the maximum observed loss at about -300 units (perhaps 5 * $.25 = -$375). And the highest observed gain at ~2400 units, which means 3 royal flushes in 800 hands, or ~$3000.
Fun stuff.
the width of the x-axis should be from -800 to 639,200 units
but how to read it without lots of zoom!
lose 800 hands in a row or hit 800 Royals in a row
both probabilities are >0
but for 8 place decimal accuracy, are left out of the party, just because those values
have no real meaning, really
Sally
Quote: mpowerNow, where I failed is finding an elegant way to calculate the probability distribution for let�s say 800 played hands. I assume the right way is to deal with discrete probabilities of every possible outcome of hand combinations. But that is a huge amount of calculation for getting the probability distribution.
the keyword is convolution.
If x1 and x2 are statistically independent, the probability distribution of the sum x1+x2 is the convolution of the probability distribution of x1 and the probability distribution of x2.
Since x1 and x2 ( ... and your x800) are all the same, all you need is the probability distribtion for a single hand (which you have, if you have the probabilities for hitting each entry in the paytable), and convolute it with itself 800 times.