
Probability of either exactly 6 banker or player in a row baccarat or roulette?
Thread Rating:
Is this correct?
What is the correct formula to work this out?
Also what is the probability of not seeing a streak of 6 either player/banker in 65 hands? 130 hands? 200 hands?
Quote: DanthemanAs far as I can work out the probability of hitting exactly 6 banker or player in a row in baccarat is approx 1/65?
Is this correct?
What is the correct formula to work this out?
Also what is the probability of not seeing a streak of 6 either player/banker in 65 hands? 130 hands? 200 hands?
Is this the baccarat playing high roller "Dan the Man" from the BBC Louis Theroux documentary about Vegas?
(Fast forward to the final 10mins.)
For baccarat, if you ignore ties, the probability of the player winning is about 49.3176%, and the banker, about 50.6824%.
The probability of going a particular number of spins without a run of 6 wins in a row is:
68.65%, for 65 spins
45.91%, for 130 spins
29.77%, for 200 spins
For the player in baccarat, if you ignore ties (i.e. determine the probability of going through N non-tied hands without the player winning 6 times in a row):
62.74% for 65 hands
38.12% for 130 hands
22.29% for 200 hands
For the banker:
58.35% for 65 hands
32.82% for 130 hands
17.66% for 200 hands
why 00 roulette? (and not 0 roulette)Quote: ThatDonGuyFor even-money bets on double-zero roulette tables, the probability of a single win is 9/19, so the probability of N wins in a row is (9/19)N. For N = 6, this is about 1 / 88.525.
and you did not point out that
6 in a row is the very next 6 spins/bets
it is at least 3 times more likely in the very next 10 spins
0.035077761
RIGHT!?
streaks RULE in gambling
cuz
all wins and losses are in streaks (length >=1)
ok
maybe after lunch i looks at your others
remember the prob of a win in a Bac shoe changes as the cards are used up
maybe a simulation would be more accurate per shoe that is
here is an accurate streak calculator i found
http://maxgriffin.net/CalcStreaks.shtml
Sally
AhhhQuote: DanthemanAlso what is the probability of not seeing a streak of 6 either player/banker in 65 hands? 130 hands? 200 hands?
you used the word
EITHER
so Dons answers are not correct, in my opinion, as i read the question differently as written
either
they are close
how close you wants?
this is like asking the chance of a run of 3 Heads or Tails in 9 flips (or = either)
not just Heads, not just Tails
like here
https://wizardofvegas.com/forum/off-topic/general/14542-please-help-a-probability-math-question/
using the streak calculator i linked tooooooooooooooooooooooooo
instead of 6 for the streak (K)
use 5
instead of 65 hands
use 64 (N)
streak length -1
AND
hands -1
for EITHER run of banker or player
i knew
i knew
it was easy
==============================
edit: i think that method only works for 50/50 bets
so i will see later
easy to simulate too
================================
nows if you just want the NO Banker prob of at least a 6 run in N hands
Don be rights
all in the way the question is interpreted
trick trick
Mully
Banker 6 in a Row win is 1 in 107.5 (75.3% chance this will happen in any 1 shoe)
Player 6 in a Row win is 1 in 126.6 (64% chance this will happen in any 1 shoe)
Banker 6 wins BEFORE a LOSS: 1 in 34.68 (will happen twice in a standard shoe)
Player 6 wins BEFORE a LOSS: 1 in 39.7 (will happen twice in a standard shoe
Formula: chance of a win ^ 6, Banker 1/(0.4586^6), and Player 1/(0.44625^6)
chance in any 1 shoe (standard rules, 8 decks) 81/chance of a win (81 is the average # of rounds in a standard shoe)
6 BEFORE a LOSS adds the chance of a tie (0.09516) to the chance of a win.
HUH?Quote: 98ClubsBaccarat: 8 decks (standard game)
Banker 6 in a Row win is 1 in 107.5 (75.3% chance this will happen in any 1 shoe)
by these sim data from me Dad
https://wizardofvegas.com/forum/gambling/tables/5928-baccarat-streaks-question/
the chance of NO 6 run or longer in an 8 deck shoe (13 or 14 card ribbon) is about 56.44%
so 43.56% chance there is at least 1 such run
(a tie does not break the streak)
you say different
"75.3% chance this will happen in any 1 shoe"
"some ONE IS way off!"
says Bill Clinton
streak probabilities are challenging to calculate (computers calculate)
easy to do something different (like the number of runs per N trials)
Sally
added:
OK
i say now 98Clubs is way off (way way off) and my Dad is about 2% off (could not find his sim data either)
here what i gots
Don, finish your homework, please. (trash goes out tonight)
thank you
my sim data
8 deck,13 card ribbon
      group        middle     freq  freq/100
--------------------------------------------
-0.5 <= x < 0.50     0.00   544738    54.47% <<< no run of 6 Banker
0.50 <= x < 1.50     1.00   349382    34.94%
1.50 <= x < 2.50     2.00    93018     9.30%
2.50 <= x < 3.50     3.00    11887     1.19%
3.50 <= x < 4.50     4.00      937     0.09%
4.50 <= x < 5.50     5.00       38     0.00%
this is close to me calculated value in Excel
i C Sally says
automate R code next project
Quote: 98ClubsFormula: chance of a win ^ 6, Banker 1/(0.4586^6), and Player 1/(0.44625^6)
chance in any 1 shoe (standard rules, 8 decks) 81/chance of a win (81 is the average # of rounds in a standard shoe)
Not quite. You are assuming that each group of 6 hands (hands 1-6, hands 2-7, hands 3-8, ..., hands 76-81) is independent of the others. If hands 1-5 are player wins and hand 6 is a bank win, then none of the groups 1-6, 2-7, 3-8, 4-9, 5-10, and 6-11 have player wins.
looks to me You are assumingQuote: ThatDonGuyNot quite. You are assuming <snip>
we have to each assume, i assume, what exactly the OP wants...
exactly...
exact
either
a Banker / Player run per N hands played
and the run = exactly 6 and no more, no no more than 6
BBB BBB P = counts as an OP success
but this does not count as an OP success
BBB BBB BB P
what really is OP after?
i knows streaks are in the OPs blood
he said in another thread
streaks rule!
Sally
yepQuote: mustangsallyusing the streak calculator i linked tooooooooooooooooooooooooo
instead of 6 for the streak (K)
use 5
instead of 65 hands
use 64 (N)
streak length -1
AND
hands -1
for EITHER run of banker or player
i knew
i knew
it was easy
==============================
edit: i think that method only works for 50/50 bets
so i will see later
easy to simulate too
================================
i was 1st wrong
i knew it after reading
ok
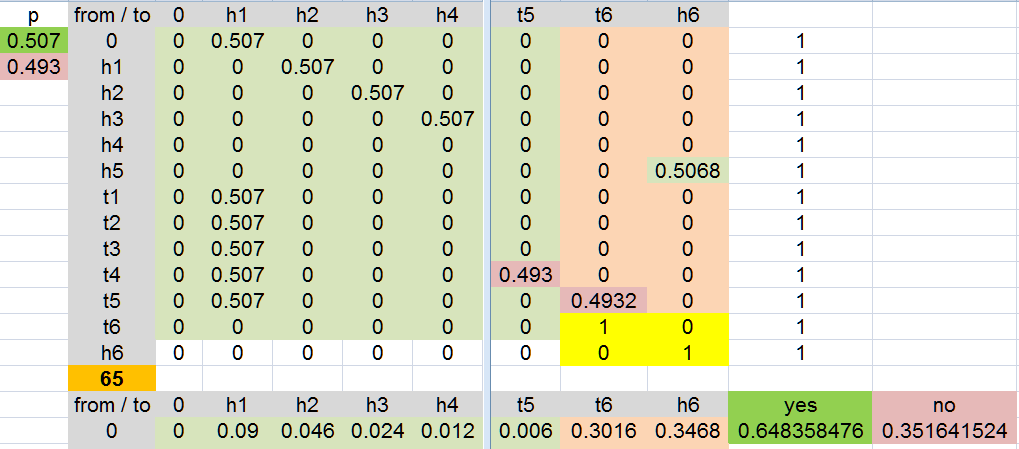
the probability of NO Banker or Player run of 6 or longer in 65 Banker/Player hands
is abouts
[1] 0.3516415
that means the prob of 1 or the other (either) is abouts
[1] 0.6483585
> ##############################################
> # Biased/unbiased  recursion of heads OR tails
> ##############################################
>
> N = 65     # number of flips
> m = 6      # length of run (must be  > 1 and <= N/2)
> p = 0.506825   # P(heads)
>
> prob = rep(0,N)
> h = rep(0,N)
> t = rep(0,N)
>
> h[m] = p^m
> t[m] = (1-p)^m
> prob[m] = h[m] + t[m]
>
> for (n in (m+1):(2*m-1)) {
+   h[n] = (1-p)*p^m
+   t[n] = p*(1-p)^m
+   prob[n] = prob[n-1] + h[n] + t[n]
+ }
>
> for (n in (2*m):N) {
+   h[n] = ((1-p) - t[n-m] - prob[n-m-1]*(1-p))*p^m
+   t[n] = (p - h[n-m] - prob[n-m-1]*p)*(1-p)^m
+   prob[n] = prob[n-1] + h[n] + t[n]
+ }
>
> # m heads OR m tails
> prob[N]
[1] 0.6483585
> 1-prob[N]
[1] 0.3516415
that was using BruceZ code (R code)
from that same link (hey, He is no longer over at 2+2. maybe he is about to release his own website!)
but I had to check this in Excel using transition matrix (sure)
yep
right on!
oh yes
130
200
simulation time too?
Sally is good
"be good"
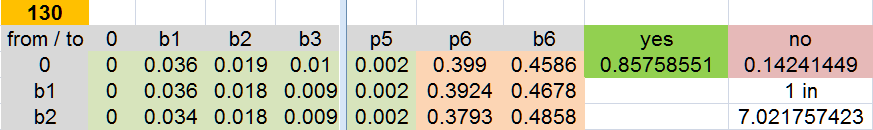
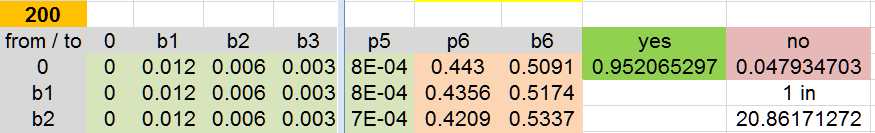
added for fun B4 dinner
for no run of 6 either B or P
in Baccarat (Tie does not break the streak) and counting all hands - Ties included
me matrix shows:
65 hands played
B or P run
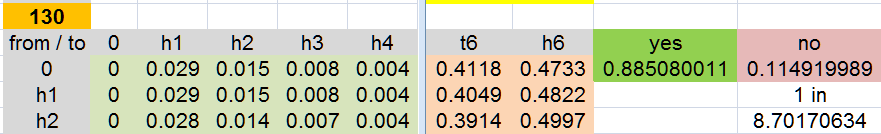
130 hands played
B or P run
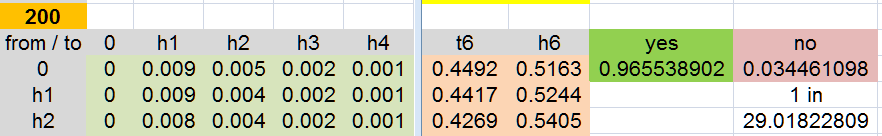
200 hands played
B or P run
Could anyone answer my question in other post about whether some streaks of different lengths are more reliable (hit to consistantly closer to expected probability) than others.
For example i found streaks of 2 would usually hit with in 3 of expected (expect 24 hit 21-27 times) over a shoe, where streaks of 3 or more werent as reliable (would swing more wildly)
For longer streaks which happen less often, they will tend to be farther from expectation for longer, compared to shorter streaks, since they happen less often.
Worded another way, the more frequently something happens, the more quickly it will show the expected results.
too addQuote: DanthemanThanks.
Could anyone answer my question in other post about whether some streaks of different lengths are more reliable (hit to consistantly closer to expected probability) than others.
the variance for smaller streaks is smaller than the larger ones (the wait time - how long do we have to wait)
you seem to be attracted to the length of streaks
where 3
say BBBP
is NOT a streak of length 2 or longer
but exactly length 3
is this right?
that is ok too
as an example because in an 8 deck shoe your values look to be way off to meQuote: DanthemanFor example i found streaks of 2 would usually hit with in 3 of expected (expect 24 hit 21-27 times) over a shoe, where streaks of 3 or more werent as reliable (would swing more wildly)
unless streaks of 2 for you are >=2 not just =2
here is a streaks summary of 1000 8 deck shoes (13 card ribbon)
----------------------- frequencies [37172 streaks] ------------------------
length      1    2    3    4    5    6    7    8    9   10   11   12   13
player   9514 4693 2243 1114  537  257  111   59   36   17    5    1    1
banker   9202 4701 2344 1151  628  287  158   80   43   12   10    6    3
        --------------------------------------------------------------------
length     14   15   16   17
player      2    1    1    1
banker      1    0    0    1
have fun with streaks!
i do
Sally
here is a larger sim sample
1 million 8 deck shoes
P and B streaks
       group         middle      freq  freq/100
-----------------------------------------------
 0.50 <= x <  1.50     1.00  18949473    50.66%
 1.50 <= x <  2.50     2.00   9348285    24.99%
 2.50 <= x <  3.50     3.00   4612786    12.33%
 3.50 <= x <  4.50     4.00   2275990     6.09%
 4.50 <= x <  5.50     5.00   1123300     3.00%
 5.50 <= x <  6.50     6.00    553106     1.48%
 6.50 <= x <  7.50     7.00    273695     0.73%
 7.50 <= x <  8.50     8.00    134253     0.36%
 8.50 <= x <  9.50     9.00     66125     0.18%
 9.50 <= x < 10.50    10.00     32767     0.09%
10.50 <= x < 11.50    11.00     16235     0.04%
11.50 <= x < 12.50    12.00      7947     0.02%
12.50 <= x < 13.50    13.00      4050     0.01%
13.50 <= x < 14.50    14.00      1863     0.00%
14.50 <= x < 15.50    15.00       892     0.00%
15.50 <= x < 16.50    16.00       467     0.00%
16.50 <= x < 17.50    17.00       264     0.00%
17.50 <= x < 18.50    18.00       143     0.00%
18.50 <= x < 19.50    19.00        60     0.00%
19.50 <= x < 20.50    20.00        36     0.00%
20.50 <= x < 21.50    21.00         8     0.00%
21.50 <= x < 22.50    22.00         4     0.00%
22.50 <= x < 23.50    23.00         3     0.00%
23.50 <= x < 24.50    24.00         2     0.00%
24.50 <= x < 25.50    25.00         1     0.00%

-----------------------------------------------
                  cumulative
-----------------------------------------------
 0.50 <= x <  1.50     1.00  18949473    50.66%
 1.50 <= x <  2.50     2.00  28297758    75.66%
 2.50 <= x <  3.50     3.00  32910544    87.99%
 3.50 <= x <  4.50     4.00  35186534    94.08%
 4.50 <= x <  5.50     5.00  36309834    97.08%
 5.50 <= x <  6.50     6.00  36862940    98.56%
 6.50 <= x <  7.50     7.00  37136635    99.29%
 7.50 <= x <  8.50     8.00  37270888    99.65%
 8.50 <= x <  9.50     9.00  37337013    99.83%
 9.50 <= x < 10.50    10.00  37369780    99.91%
10.50 <= x < 11.50    11.00  37386015    99.96%
11.50 <= x < 12.50    12.00  37393962    99.98%
12.50 <= x < 13.50    13.00  37398012    99.99%
13.50 <= x < 14.50    14.00  37399875    99.99%
14.50 <= x < 15.50    15.00  37400767   100.00%
15.50 <= x < 16.50    16.00  37401234   100.00%
16.50 <= x < 17.50    17.00  37401498   100.00%
17.50 <= x < 18.50    18.00  37401641   100.00%
18.50 <= x < 19.50    19.00  37401701   100.00%
19.50 <= x < 20.50    20.00  37401737   100.00%
20.50 <= x < 21.50    21.00  37401745   100.00%
21.50 <= x < 22.50    22.00  37401749   100.00%
22.50 <= x < 23.50    23.00  37401752   100.00%
23.50 <= x < 24.50    24.00  37401754   100.00%
24.50 <= x < 25.50    25.00  37401755   100.00%
Only P streaks
       group         streak      freq  freq/100
      -----------------------------------------------
 0.50 <= x <  1.50     1.00   9591472    51.31%
 1.50 <= x <  2.50     2.00   4674314    25.00%
 2.50 <= x <  3.50     3.00   2273436    12.16%
 3.50 <= x <  4.50     4.00   1107294     5.92%
 4.50 <= x <  5.50     5.00    538186     2.88%
 5.50 <= x <  6.50     6.00    261965     1.40%
 6.50 <= x <  7.50     7.00    127691     0.68%
 7.50 <= x <  8.50     8.00     61671     0.33%
 8.50 <= x <  9.50     9.00     29881     0.16%
 9.50 <= x < 10.50    10.00     14511     0.08%
10.50 <= x < 11.50    11.00      7095     0.04%
11.50 <= x < 12.50    12.00      3395     0.02%
12.50 <= x < 13.50    13.00      1748     0.01%
13.50 <= x < 14.50    14.00       766     0.00%
14.50 <= x < 15.50    15.00       372     0.00%
15.50 <= x < 16.50    16.00       185     0.00%
16.50 <= x < 17.50    17.00        92     0.00%
17.50 <= x < 18.50    18.00        57     0.00%
18.50 <= x < 19.50    19.00        22     0.00%
19.50 <= x < 20.50    20.00        12     0.00%
20.50 <= x < 21.50    21.00         3     0.00%
21.50 <= x < 22.50    22.00         1     0.00%
22.50 <= x < 23.50    23.00         0
23.50 <= x < 24.50    24.00         2     0.00%
24.50 <= x < 25.50    25.00         1     0.00%

-----------------------------------------------
                  cumulative
-----------------------------------------------
 0.50 <= x <  1.50     1.00   9591472    51.31%
 1.50 <= x <  2.50     2.00  14265786    76.31%
 2.50 <= x <  3.50     3.00  16539222    88.47%
 3.50 <= x <  4.50     4.00  17646516    94.40%
 4.50 <= x <  5.50     5.00  18184702    97.27%
 5.50 <= x <  6.50     6.00  18446667    98.68%
 6.50 <= x <  7.50     7.00  18574358    99.36%
 7.50 <= x <  8.50     8.00  18636029    99.69%
 8.50 <= x <  9.50     9.00  18665910    99.85%
 9.50 <= x < 10.50    10.00  18680421    99.93%
10.50 <= x < 11.50    11.00  18687516    99.96%
11.50 <= x < 12.50    12.00  18690911    99.98%
12.50 <= x < 13.50    13.00  18692659    99.99%
13.50 <= x < 14.50    14.00  18693425   100.00%
14.50 <= x < 15.50    15.00  18693797   100.00%
15.50 <= x < 16.50    16.00  18693982   100.00%
16.50 <= x < 17.50    17.00  18694074   100.00%
17.50 <= x < 18.50    18.00  18694131   100.00%
18.50 <= x < 19.50    19.00  18694153   100.00%
19.50 <= x < 20.50    20.00  18694165   100.00%
20.50 <= x < 21.50    21.00  18694168   100.00%
21.50 <= x < 22.50    22.00  18694169   100.00%
22.50 <= x < 23.50    23.00  18694169   100.00%
23.50 <= x < 24.50    24.00  18694171   100.00%
24.50 <= x < 25.50    25.00  18694172   100.00%
only B streaks
         group         streak     freq   freq/100
		-----------------------------------------------
 0.50 <= x <  1.50     1.00   9358001    50.02%
 1.50 <= x <  2.50     2.00   4673971    24.98%
 2.50 <= x <  3.50     3.00   2339350    12.50%
 3.50 <= x <  4.50     4.00   1168696     6.25%
 4.50 <= x <  5.50     5.00    585114     3.13%
 5.50 <= x <  6.50     6.00    291141     1.56%
 6.50 <= x <  7.50     7.00    146004     0.78%
 7.50 <= x <  8.50     8.00     72582     0.39%
 8.50 <= x <  9.50     9.00     36244     0.19%
 9.50 <= x < 10.50    10.00     18256     0.10%
10.50 <= x < 11.50    11.00      9140     0.05%
11.50 <= x < 12.50    12.00      4552     0.02%
12.50 <= x < 13.50    13.00      2302     0.01%
13.50 <= x < 14.50    14.00      1097     0.01%
14.50 <= x < 15.50    15.00       520     0.00%
15.50 <= x < 16.50    16.00       282     0.00%
16.50 <= x < 17.50    17.00       172     0.00%
17.50 <= x < 18.50    18.00        86     0.00%
18.50 <= x < 19.50    19.00        38     0.00%
19.50 <= x < 20.50    20.00        24     0.00%
20.50 <= x < 21.50    21.00         5     0.00%
21.50 <= x < 22.50    22.00         3     0.00%
22.50 <= x < 23.50    23.00         3     0.00%

-----------------------------------------------
                  cumulative
-----------------------------------------------
 0.50 <= x <  1.50     1.00   9358001    50.02%
 1.50 <= x <  2.50     2.00  14031972    75.01%
 2.50 <= x <  3.50     3.00  16371322    87.51%
 3.50 <= x <  4.50     4.00  17540018    93.76%
 4.50 <= x <  5.50     5.00  18125132    96.89%
 5.50 <= x <  6.50     6.00  18416273    98.44%
 6.50 <= x <  7.50     7.00  18562277    99.22%
 7.50 <= x <  8.50     8.00  18634859    99.61%
 8.50 <= x <  9.50     9.00  18671103    99.80%
 9.50 <= x < 10.50    10.00  18689359    99.90%
10.50 <= x < 11.50    11.00  18698499    99.95%
11.50 <= x < 12.50    12.00  18703051    99.98%
12.50 <= x < 13.50    13.00  18705353    99.99%
13.50 <= x < 14.50    14.00  18706450    99.99%
14.50 <= x < 15.50    15.00  18706970   100.00%
15.50 <= x < 16.50    16.00  18707252   100.00%
16.50 <= x < 17.50    17.00  18707424   100.00%
17.50 <= x < 18.50    18.00  18707510   100.00%
18.50 <= x < 19.50    19.00  18707548   100.00%
19.50 <= x < 20.50    20.00  18707572   100.00%
20.50 <= x < 21.50    21.00  18707577   100.00%
21.50 <= x < 22.50    22.00  18707580   100.00%
22.50 <= x < 23.50    23.00  18707583   100.00%
Quote: ThatDonGuyNot quite. You are assuming that each group of 6 hands (hands 1-6, hands 2-7, hands 3-8, ..., hands 76-81) is independent of the others. If hands 1-5 are player wins and hand 6 is a bank win, then none of the groups 1-6, 2-7, 3-8, 4-9, 5-10, and 6-11 have player wins.
All I did was take the chance of a win and raise it to the 6th power. Then inverted the fraction for 1 in x analysis.
For 6 Before a loss the chance of a tie was added to the chance of a win, then raised to the 6th power. Again the fraction was inverted for '1 in x' analysis.
Streak analysis involves "less than, greater than, or equal to" phrasing. The OP wanted to know the chance of 6 Banker wins and 6 Player wins in a row... nothing else. The simple math used does not presume when the streak starts. It only states the probabiliity of the occurance based upon winning percentage. In fact, neither 6 consecutive or 6 before a loss presumes such will occur in one shoe ( hands 79, 80, 81, Shuffle/cut/burn. 1, 2, and 3).
I made no assumption, just did the easy math of chance ^6.
that appears to me to be your opinionQuote: 98ClubsThe OP wanted to know the chance of 6 Banker wins and 6 Player wins in a row... nothing else.
OP used the word either and or
that means, to me, one or the other and not both
but we may never really know
OP seems happy :)
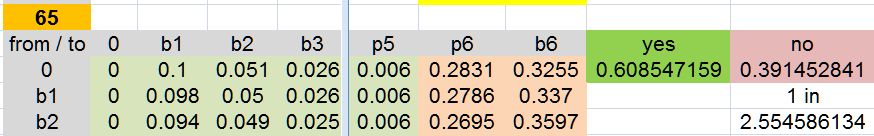
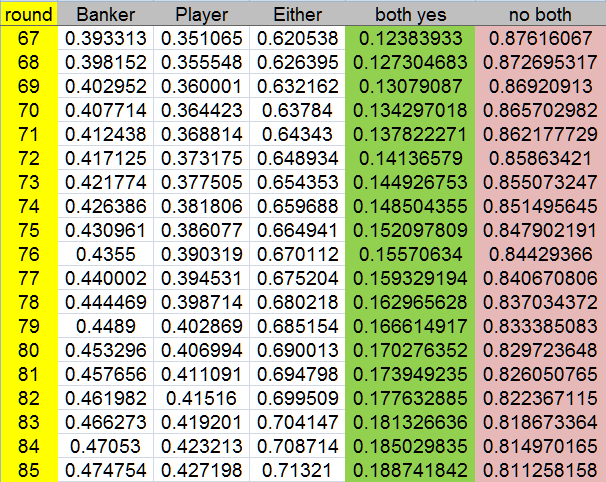
my Excel shows this (as well as a few sims)
example 1
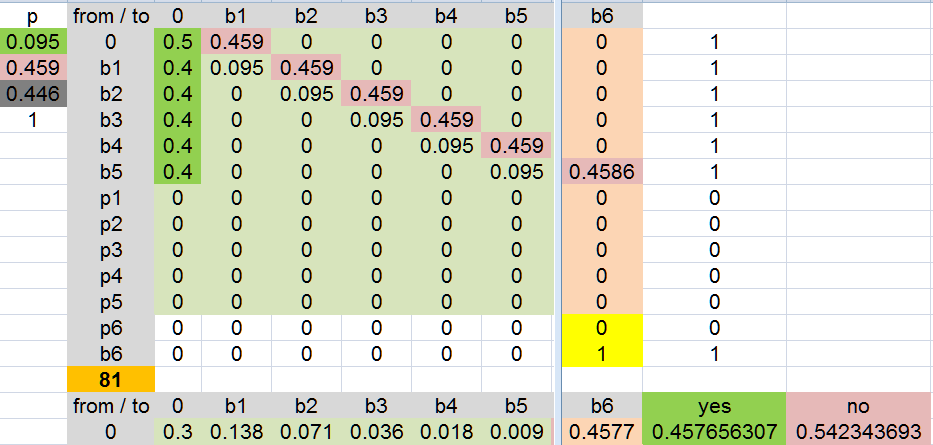
Banker run of 6 in 81 hands (Ties do NOT break the run): 0.457656307
Player run of 6 in 81 hands (Ties do NOT break the run): 0.411091138
Either (NOT both): 0.694798211
Banker AND Player 6 run: 0.173949235
example 2
Banker run of 6 in 74 hands (Ties do NOT break the run): 0.426386042
Player run of 6 in 74 hands (Ties do NOT break the run): 0.381806137
Either (NOT both): 0.659687823
Banker AND Player 6 run: 0.148504355
ask not for my workbooks
Sally
So the variance on shorter streaks is less, does this include streaks of 1 or more?
As the simple banker/ player appears to be have a higher variance at a glance?
Quote: sisyphusWhat role does probability play in games of chance? Assuming, Banker/Player is 50/50, what difference does it make if we have a 10 in a row banker run? Apparently probability never changes even after a banker run of 23. It's always 50/50? But why do streaks end?
Why do streaks end? Well, that's like asking "why did the coin I flipped land on tails?" It's just probability/statistics/math.