
Anomaly found in Nevada revenue reports
The odd thing was that when I graphed every denomination on the same chart, there was a VERY strong correlation between the denominations. One month every denomination would be up 1% or 2% and the next month every denomination would be down 1% or 2%.
I cant come up with a reasonable explanation that explains this. Ive all but ruled out that the casinos are changing the RTP, but i still cant come up with anything that explains it. I made a video about it here.
https://youtu.be/QPefZmR_kck
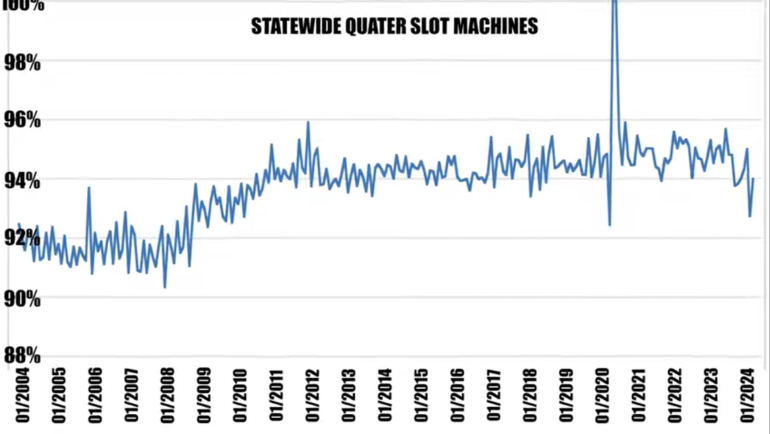
Have you checked to see whether the number of weekend days per month correlates with the changes that you see?Quote: VegasEducationI was working on a video to explain how casinos dont change the RTP of the slot machines. I downloaded all of the revenue reports from the state. I graphed the different denominations over time. For example, state-wide quarter machines were averaging around 91.5% from 2004-2009. Then the statewide trend was increasing to about 94.5% on average. This all looked reasonable and what i was trying to prove with my video. RTPs might change over decades but not a month at a time.
The odd thing was that when I graphed every denomination on the same chart, there was a VERY strong correlation between the denominations. One month every denomination would be up 1% or 2% and the next month every denomination would be down 1% or 2%.
I cant come up with a reasonable explanation that explains this. Ive all but ruled out that the casinos are changing the RTP, but i still cant come up with anything that explains it. I made a video about it here.
https://youtu.be/QPefZmR_kck
link to original post
If weekend players tend to play games with a bigger house edge, then you would expect months with more weekend days would have a lower return. This would be true across all denominations even with everything else being constant.
I can think of many reasons that RTP would be different on every day of the week. When the casino is busier, video poker players might be forced to play worse pay tables (or even move to slots) because they cannot get a seat at the preferred/better VP machines. The makeup of weekend crowds might be much different and more skewed towards slot play versus higher return VP games.
If the data is not correlated with number of weekend days in a given month, then my hypothesis is BS. You could check this quickly for a few months. But we are 100% certain that consecutive months often have a different number of weekend days. There is a also very obvious periodicity in the monthly data. If you did a Fourier analysis on each series, I think you would find a very strong frequency component at a wavelength around three months. There are about 13 weeks in three months, so this is approximately the frequency where months come around with two full weekends. Months like February mess with the periodicity a bit. Still, a very strong Fourier component around three months would be a smoking gun that this is just an easily explained day-of-the-week effect.
This is a very well known effect for retail sales per day. Economists correct for this day-of-the-week effect when they compile some kinds of monthly retail data.
Quote: MentalHave you checked to see whether the number of weekend days per month correlates with the changes that you see?Quote: VegasEducationI was working on a video to explain how casinos dont change the RTP of the slot machines. I downloaded all of the revenue reports from the state. I graphed the different denominations over time. For example, state-wide quarter machines were averaging around 91.5% from 2004-2009. Then the statewide trend was increasing to about 94.5% on average. This all looked reasonable and what i was trying to prove with my video. RTPs might change over decades but not a month at a time.
The odd thing was that when I graphed every denomination on the same chart, there was a VERY strong correlation between the denominations. One month every denomination would be up 1% or 2% and the next month every denomination would be down 1% or 2%.
I cant come up with a reasonable explanation that explains this. Ive all but ruled out that the casinos are changing the RTP, but i still cant come up with anything that explains it. I made a video about it here.
https://youtu.be/QPefZmR_kck
link to original post
If weekend players tend to play games with a bigger house edge, then you would expect months with more weekend days would have a lower return. This would be true across all denominations even with everything else being constant.
I can think of many reasons that RTP would be different on every day of the week. When the casino is busier, video poker players might be forced to play worse pay tables (or even move to slots) because they cannot get a seat at the preferred/better VP machines. The makeup of weekend crowds might be much different and more skewed towards slot play versus higher return VP games.
If the data is not correlated with number of weekend days in a given month, then my hypothesis is BS. You could check this quickly for a few months. But we are 100% certain that consecutive months often have a different number of weekend days. There is a also very obvious periodicity in the monthly data. If you did a Fourier analysis on each series, I think you would find a very strong frequency component at a wavelength around three months. There are about 13 weeks in three months, so this is approximately the frequency where months come around with two full weekends. Months like February mess with the periodicity a bit. Still, a very strong Fourier component around three months would be a smoking gun that this is just an easily explained day-of-the-week effect.
This is a very well known effect for retail sales per day. Economists correct for this day-of-the-week effect when they compile some kinds of monthly retail data.
link to original post
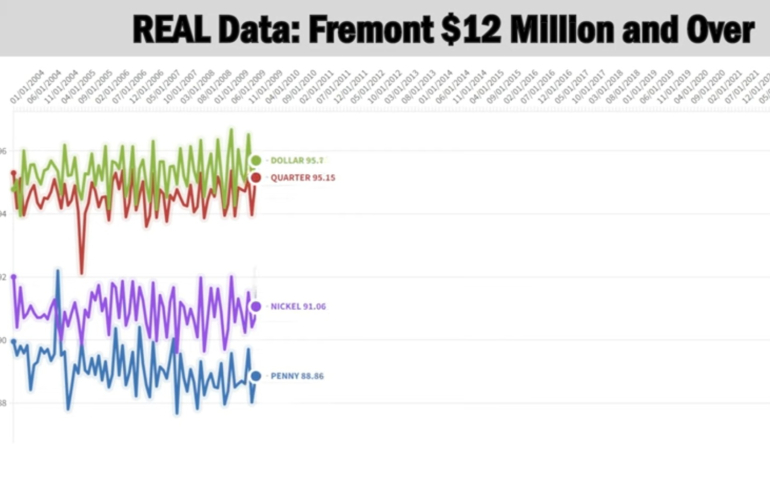
Ill give it a check, but i have a hard time believing it would be THAT correlated just by one extra weekend or something. Its not just a little correlation. There are periods that every single denomination moves in almost perfect sync. To throw another wrench in it, if i compare ANY denomination from one area to ANY denomination in another area, they also correlate almost perfectly. Something like the penny denomination in lake tahoe to the dollar denomination on the strip to the 5 dollars in carson valley. Theyd all still move in almost perfect sync.
Quote: VegasEducationIll give it a check, but i have a hard time believing it would be THAT correlated just by one extra weekend or something. Its not just a little correlation. There are periods that every single denomination moves in almost perfect sync. To throw another wrench in it, if i compare ANY denomination from one area to ANY denomination in another area, they also correlate almost perfectly. Something like the penny denomination in lake tahoe to the dollar denomination on the strip to the 5 dollars in carson valley. Theyd all still move in almost perfect sync.
link to original post
Weekends are correlated across the entire state of Nevada the last I checked.
The Retail 4-5-4 Calendar was invented because this effect is huge in retail sales.
https://retailminded.com/retail-calendar/
Quote: MentalQuote: VegasEducationIll give it a check, but i have a hard time believing it would be THAT correlated just by one extra weekend or something. Its not just a little correlation. There are periods that every single denomination moves in almost perfect sync. To throw another wrench in it, if i compare ANY denomination from one area to ANY denomination in another area, they also correlate almost perfectly. Something like the penny denomination in lake tahoe to the dollar denomination on the strip to the 5 dollars in carson valley. Theyd all still move in almost perfect sync.
link to original post
Weekends are correlated across the entire state of Nevada the last I checked.
The Retail 4-5-4 Calendar was invented because this effect is huge in retail sales.
https://retailminded.com/retail-calendar/
link to original post
Ill check it. Ill graph the number of Saturdays in the month on the same chart as the win rate and see if theres any correlation
Quote: VegasEducation
Ill check it. Ill graph the number of Saturdays in the month on the same chart as the win rate and see if theres any correlation
link to original post
Alternately, you could just take a subset of the data for months that start on a specific day of the week. If I am right, you should see a graph with smaller fluctuations that are uncorrelated.
But, then you only have one seventh as much data. Taking all months starting on a Mon/Tues/Wed would leave more data in the dataset.
I used a simple excel formula to separate out the months by the day of the week they start on. Sunday is 1 and Saturday is 7.
1	02/01/04
1	08/01/04
1	05/01/05
1	01/01/06
1	10/01/06
1	04/01/07
1	07/01/07
1	06/01/08
1	02/01/09
1	03/01/09
1	11/01/09
1	08/01/10
1	05/01/11
1	01/01/12
1	04/01/12
1	07/01/12
1	09/01/13
1	12/01/13
1	06/01/14
1	02/01/15
1	03/01/15
1	11/01/15
1	05/01/16
1	01/01/17
1	10/01/17
1	04/01/18
1	07/01/18
1	09/01/19
1	12/01/19
1	03/01/20
1	11/01/20
1	08/01/21
1	05/01/22
1	01/01/23
1	10/01/23
1	09/01/24
1	12/01/24
1	06/01/25
1	02/01/26
1	03/01/26
2	03/01/04
2	11/01/04
2	08/01/05
2	05/01/06
2	01/01/07
2	10/01/07
2	09/01/08
2	12/01/08
2	06/01/09
2	02/01/10
2	03/01/10
2	11/01/10
2	08/01/11
2	10/01/12
2	04/01/13
2	07/01/13
2	09/01/14
2	12/01/14
2	06/01/15
2	02/01/16
2	08/01/16
2	05/01/17
2	01/01/18
2	10/01/18
2	04/01/19
2	07/01/19
2	06/01/20
2	02/01/21
2	03/01/21
2	11/01/21
2	08/01/22
2	05/01/23
2	01/01/24
2	04/01/24
2	07/01/24
2	09/01/25
2	12/01/25
2	06/01/26
3	06/01/04
3	02/01/05
3	03/01/05
3	11/01/05
3	08/01/06
3	05/01/07
3	01/01/08
3	04/01/08
3	07/01/08
3	09/01/09
3	12/01/09
3	06/01/10
3	02/01/11
3	03/01/11
3	11/01/11
3	05/01/12
3	01/01/13
3	10/01/13
3	04/01/14
3	07/01/14
3	09/01/15
3	12/01/15
3	03/01/16
3	11/01/16
3	08/01/17
3	05/01/18
3	01/01/19
3	10/01/19
3	09/01/20
3	12/01/20
3	06/01/21
3	02/01/22
3	03/01/22
3	11/01/22
3	08/01/23
3	10/01/24
3	04/01/25
3	07/01/25
4	09/01/04
4	12/01/04
4	06/01/05
4	02/01/06
4	03/01/06
4	11/01/06
4	08/01/07
4	10/01/08
4	04/01/09
4	07/01/09
4	09/01/10
4	12/01/10
4	06/01/11
4	02/01/12
4	08/01/12
4	05/01/13
4	01/01/14
4	10/01/14
4	04/01/15
4	07/01/15
4	06/01/16
4	02/01/17
4	03/01/17
4	11/01/17
4	08/01/18
4	05/01/19
4	01/01/20
4	04/01/20
4	07/01/20
4	09/01/21
4	12/01/21
4	06/01/22
4	02/01/23
4	03/01/23
4	11/01/23
4	05/01/24
4	01/01/25
4	10/01/25
4	04/01/26
4	07/01/26
5	01/01/04
5	04/01/04
5	07/01/04
5	09/01/05
5	12/01/05
5	06/01/06
5	02/01/07
5	03/01/07
5	11/01/07
5	05/01/08
5	01/01/09
5	10/01/09
5	04/01/10
5	07/01/10
5	09/01/11
5	12/01/11
5	03/01/12
5	11/01/12
5	08/01/13
5	05/01/14
5	01/01/15
5	10/01/15
5	09/01/16
5	12/01/16
5	06/01/17
5	02/01/18
5	03/01/18
5	11/01/18
5	08/01/19
5	10/01/20
5	04/01/21
5	07/01/21
5	09/01/22
5	12/01/22
5	06/01/23
5	02/01/24
5	08/01/24
5	05/01/25
5	01/01/26
6	10/01/04
6	04/01/05
6	07/01/05
6	09/01/06
6	12/01/06
6	06/01/07
6	02/01/08
6	08/01/08
6	05/01/09
6	01/01/10
6	10/01/10
6	04/01/11
6	07/01/11
6	06/01/12
6	02/01/13
6	03/01/13
6	11/01/13
6	08/01/14
6	05/01/15
6	01/01/16
6	04/01/16
6	07/01/16
6	09/01/17
6	12/01/17
6	06/01/18
6	02/01/19
6	03/01/19
6	11/01/19
6	05/01/20
6	01/01/21
6	10/01/21
6	04/01/22
6	07/01/22
6	09/01/23
6	12/01/23
6	03/01/24
6	11/01/24
6	08/01/25
6	05/01/26
7	05/01/04
7	01/01/05
7	10/01/05
7	04/01/06
7	07/01/06
7	09/01/07
7	12/01/07
7	03/01/08
7	11/01/08
7	08/01/09
7	05/01/10
7	01/01/11
7	10/01/11
7	09/01/12
7	12/01/12
7	06/01/13
7	02/01/14
7	03/01/14
7	11/01/14
7	08/01/15
7	10/01/16
7	04/01/17
7	07/01/17
7	09/01/18
7	12/01/18
7	06/01/19
7	02/01/20
7	08/01/20
7	05/01/21
7	01/01/22
7	10/01/22
7	04/01/23
7	07/01/23
7	06/01/24
7	02/01/25
7	03/01/25
7	11/01/25
Quote: WizardI find the original question interesting. Personally, I would rule out a state-wide adjustment in slot RTP on a monthly basis with 99.54% probability. However, what does account for the RTP between various denominations being so correlated with each other by time? My best guess is some kind of bookkeeping tricks. Maybe Gaming does not have complete data by denomination, but does have overall RTP, so is making their best estimate, using standard differences between them. Just a guess. When I was a government actuary, we had to do the best we could with partial information all the time.
link to original post
I agree. It has to be some kind of book keeping thing. My thought is that the win rate is some kind of formula that is derived from the total revenue. Which makes no sense when they should have the actual RTP numbers. I dont think i'm going to get anything useful out of this, but its really bugging me that i can't find the answer.
I really need to graph the total revenue with it to see if it correlates. I would bet it does
I suspect that the two of us caused a noticeable difference to the handle and the RTP for the casino on that day. This casino usually set their leaderboards to end on the same day of the week every week. There might be a noticeable difference between months where there were 5 leaderboards ending versus months where only four leaderboards concluded.
I actually have some data that would allow me to estimate how much relative handle online companies get each day of the week. It would take some work to get this processed into a nice chart.
Quote: WizardI find the original question interesting. Personally, I would rule out a state-wide adjustment in slot RTP on a monthly basis with 99.54% probability. However, what does account for the RTP between various denominations being so correlated with each other by time? My best guess is some kind of bookkeeping tricks. Maybe Gaming does not have complete data by denomination, but does have overall RTP, so is making their best estimate, using standard differences between them. Just a guess. When I was a government actuary, we had to do the best we could with partial information all the time.
link to original post
Didn't you ever have to adjust your data to take into account the number of weekend days in a month?
With the nickel and penny paybacks so awful and most machines are penny slots with 88 coins or some such per spin, that's sub-90% RTP out there. There's some math to do to figure out how much you lose with $10,000 coin-in on a penny slot versus a nickel slot versus a quarter slot versus a dollar slot; but you'll be losing several extra hundred dollars at the lower denoms.
Just checking the video link above, the multi-denom machines have a much higher RTP at around 95% compared to actual penny and nickel slots of sub-90%. Maybe because high rollers come in and play for $50 a spin and skew the results, who knows.
July and August both have back to back 31 days. February only 28(29) so less days factored in?
Perhaps they are using a monthly formula based on 30 day averages? And the longer/shorter months throw it off?
It is possible, I suppose. But the data has regular spikes that occur about 4 times per year. Months with five Saturdays occur about four times per year. There is only one February per year.Quote: darkozAny possibility it has to do with number of days and holidays/busy seasons.
July and August both have back to back 31 days. February only 28(29) so less days factored in?
Perhaps they are using a monthly formula based on 30 day averages? And the longer/shorter months throw it off?
link to original post
Occam's razor tells me that if the 5-weekend months line up with the data, then we don't need to posit some sort of accounting blunder. We also don't need to posit that the casinos change the RTP of the games four times a year.
You spend a lot of time in B&M casinos. Do you agree that the geriatric weekday crowds and the weekend warriors are different sets of people with different sets of behaviors and tastes? I find it easy to believe they play a different mix of VP and slots at every denomination of interest to this question.
Quote: MentalTo my eye, the graph of the number of Saturdays per month looks similar to your graph of RTP over this five year period. It has somewhat regular peaks with about the right spacing. I hope you can create the graph that exactly aligns the number of Saturdays pr month with your RTP data.
link to original post
Yes. I have it all worked out how to overlay it exactly. Im just going to add 90 to the number of Saturdays. So, instead of 4 and 5 Saturdays, itll move around 94 and 95 on the same graph as the percentages
But it just comes down to seeing things that aren't there, and we piled on Mental in my results thread over that already.
Quote: ChumpChangeThe numbers were abysmally low around 92% until the financial crash of 2008, then in order to lure customers back in they raised the RTP up to 94%-95% over the next couple of years and it stayed there. But I'm seeing 2% swings on a monthly basis on this chart. They could be low-balling some machines while leaving other machines alone. It becomes a battlefield of whack-a-mole for customers to find a higher paying machine then the casino tightens them down then loosens another bank of slots up for a month to get some action then tightens them back down. Some here say the machines aren't touched because of the red tape involved. Maybe they do go through the red tape as a matter of course and quite often. Why are the charts so inconsistent but for jackpot payouts?
link to original post
The reason that it can't be the casinos changing the rtp is that wildly different areas of the state are in perfect coordination. If we entertain the idea that casinos are changing the RTP every single month, i could also entertain the idea that Caesars and MGM have reason to change their RTPs at the same time. Even though I don't think it's happening, i could imagine it. I cant imagine any reason that elko county, lake tahoe and the strip are all in perfect coordination. It doesnt matter which county i look at, they are all in sync. Thats getting so far out there that i think that theory completely falls apart.
Quote: WizardI must say I like the Saturday theory. I look forward to seeing more evidence to confirm or deny it.
link to original post
here is the graph. It seems to correlate sometimes but not others. I think tomorrow I will try more testing. Maybe I'll try counting the number of Fridays, Saturdays and Sundays.
This is really great work. Whatever graphics package you are using is really good, and you obviously are skilled at using it. I see plenty of instances where the Saturday count is correlated. The video really allows us to see correlation that is hard to see in the static chart.Quote: VegasEducationQuote: WizardI must say I like the Saturday theory. I look forward to seeing more evidence to confirm or deny it.
link to original post
here is the graph. It seems to correlate sometimes but not others. I think tomorrow I will try more testing. Maybe I'll try counting the number of Fridays, Saturdays and Sundays.
link to original post
Have you tried calculating the correlation coefficients? You could try using the CORREL() function in your spreadsheet.
I would think it would correlate better if you count Fridays and Sundays as a half day and Saturdays as a full day.
01/04	1.5
02/04	0.5
03/04	0
04/04	0.5
05/04	1.5
06/04	0
07/04	1.5
08/04	0.5
09/04	0
10/04	2
11/04	0
12/04	0.5
01/05	1.5
02/05	0
03/05	0
04/05	1.5
05/05	0.5
06/05	0
07/05	2
08/05	0
09/05	0.5
10/05	1.5
11/05	0
12/05	1.5
01/06	0.5
02/06	0
03/06	0.5
04/06	1.5
05/06	0
06/06	0.5
07/06	1.5
08/06	0
09/06	1.5
10/06	0.5
11/06	0
12/06	2
01/07	0
02/07	0
03/07	1.5
04/07	0.5
05/07	0
06/07	1.5
07/07	0.5
08/07	0.5
09/07	1.5
10/07	0
11/07	0.5
12/07	1.5
01/08	0
02/08	0.5
03/08	1.5
04/08	0
05/08	1.5
06/08	0.5
07/08	0
08/08	2
09/08	0
10/08	0.5
11/08	1.5
12/08	0
01/09	1.5
02/09	0
03/09	0.5
04/09	0
05/09	2
06/09	0
07/09	0.5
08/09	1.5
09/09	0
10/09	1.5
11/09	0.5
12/09	0
01/10	2
02/10	0
03/10	0
04/10	0.5
05/10	1.5
06/10	0
07/10	1.5
08/10	0.5
09/10	0
10/10	2
11/10	0
12/10	0.5
01/11	1.5
02/11	0
03/11	0
04/11	1.5
05/11	0.5
06/11	0
07/11	2
08/11	0
09/11	0.5
10/11	1.5
11/11	0
12/11	1.5
01/12	0.5
02/12	0
03/12	1.5
04/12	0.5
05/12	0
06/12	1.5
07/12	0.5
08/12	0.5
09/12	1.5
10/12	0
11/12	0.5
12/12	1.5
01/13	0
02/13	0
03/13	2
04/13	0
05/13	0.5
06/13	1.5
07/13	0
08/13	1.5
09/13	0.5
10/13	0
11/13	1.5
12/13	0.5
01/14	0.5
02/14	0
03/14	1.5
04/14	0
05/14	1.5
06/14	0.5
07/14	0
08/14	2
09/14	0
10/14	0.5
11/14	1.5
12/14	0
01/15	1.5
02/15	0
03/15	0.5
04/15	0
05/15	2
06/15	0
07/15	0.5
08/15	1.5
09/15	0
10/15	1.5
11/15	0.5
12/15	0
01/16	2
02/16	0
03/16	0
04/16	1.5
05/16	0.5
06/16	0
07/16	2
08/16	0
09/16	0.5
10/16	1.5
11/16	0
12/16	1.5
01/17	0.5
02/17	0
03/17	0.5
04/17	1.5
05/17	0
06/17	0.5
07/17	1.5
08/17	0
09/17	1.5
10/17	0.5
11/17	0
12/17	2
01/18	0
02/18	0
03/18	1.5
04/18	0.5
05/18	0
06/18	1.5
07/18	0.5
08/18	0.5
09/18	1.5
10/18	0
11/18	0.5
12/18	1.5
01/19	0
02/19	0
03/19	2
04/19	0
05/19	0.5
06/19	1.5
07/19	0
08/19	1.5
09/19	0.5
10/19	0
11/19	1.5
12/19	0.5
01/20	0.5
02/20	1
03/20	0.5
04/20	0
05/20	2
06/20	0
07/20	0.5
08/20	1.5
09/20	0
10/20	1.5
11/20	0.5
12/20	0
01/21	2
02/21	0
03/21	0
04/21	0.5
05/21	1.5
06/21	0
07/21	1.5
08/21	0.5
09/21	0
10/21	2
11/21	0
12/21	0.5
01/22	1.5
02/22	0
03/22	0
04/22	1.5
05/22	0.5
06/22	0
07/22	2
08/22	0
09/22	0.5
10/22	1.5
11/22	0
12/22	1.5
01/23	0.5
02/23	0
03/23	0.5
04/23	1.5
05/23	0
06/23	0.5
07/23	1.5
08/23	0
09/23	1.5
10/23	0.5
11/23	0
12/23	2
01/24	0
02/24	0
03/24	2
04/24	0
05/24	0.5
06/24	1.5
07/24	0
08/24	1.5
09/24	0.5
10/24	0
11/24	1.5
12/24	0.5
01/25	0.5
02/25	0
03/25	1.5
04/25	0
05/25	1.5
06/25	0.5
07/25	0
08/25	2
09/25	0
10/25	0.5
11/25	1.5
12/25	0
I noticed that months with five Fri, Sat, and Sun only happen about once a year.
Quote: VegasEducationQuote: WizardI must say I like the Saturday theory. I look forward to seeing more evidence to confirm or deny it.
link to original post
here is the graph. It seems to correlate sometimes but not others. I think tomorrow I will try more testing. Maybe I'll try counting the number of Fridays, Saturdays and Sundays.
link to original post
I don't actually think it's Saturdays that are extra. That's only one extra heavy day for what you say are large differences.
Also, one casinos Saturday is not the same as another. Saturdays are the heavy promo/event days. So larger crowds but differences in casinos. A strip casino with a Beyonce concert isn't going to compare with a out of the way desert casino giving out free 50" tv's or having Travis Tritt in concert.
Boxing nights often on weekends for example will heavily skew results but mostly for the hosting casinos. Not all of them.
Since you say it's consistent for all casinos in Nevada I suspect it's a design flaw (not necessarily a flaw perhaps but something skewing) with the formula or data collection process.
For example here is a theory that also looks at number of days being tabulated different but not because of extra Saturdays
Using freeplay offers as a comparison, most properties seem to prefer starting their weeks and months on a Monday. This throws askew calendar predictions (something I am painfully aware of as my schedule is never easy to predict until I see the final calendar).
A month that begins on a Thursday gets either shortened (Thursday May 1st let's say. Casinos schedule either begins Monday April 28th or Monday May 5th).
So just to posit a theory, what if the formula is to tabulated monthly RTP, nearest Monday to Sunday. Some months would result in a higher RTP due to being artificially stretched a few days earlier/later, others shortened artificially.
You could start with comparison of months with midweek changes and see if it gets worse as the days are midweek.
Months with Monday as the first day would be lowest RTP I would think as the first day perfectly correlates with the beginning of data collection.
I'm thinking this might be your solution because monthly I try to calculate not just my schedule but probable profit from freeplay and always I get thrown for some loop somewhere (oh damn, I thought I had FIVE weeks of freeplay, that sucks, they went the other direction).
Of course it could be a different day than Mondays. And of course I could be totally wrong. But it would create weird and skewed results monthly across the entire state.
EDIT: Giving it even more thought it always bugged me why it's so consistently Mondays that casinos begin their weeks and months for freeplay offers.
I wonder if it isn't connected. For example RTP has to be heavily affected by freeplay allowances. So what if so many properties start cqlendars on Monday because they have to accommodate the RTP collection process of the state?
(And it isn't every property but it is quite a lot)
Just another bone to throw into the soup.
Quote: MentalThis is really great work. Whatever graphics package you are using is really good, and you obviously are skilled at using it. I see plenty of instances where the Saturday count is correlated. The video really allows us to see correlation that is hard to see in the static chart.Quote: VegasEducationQuote: WizardI must say I like the Saturday theory. I look forward to seeing more evidence to confirm or deny it.
link to original post
here is the graph. It seems to correlate sometimes but not others. I think tomorrow I will try more testing. Maybe I'll try counting the number of Fridays, Saturdays and Sundays.
link to original post
Have you tried calculating the correlation coefficients? You could try using the CORREL() function in your spreadsheet.
I would think it would correlate better if you count Fridays and Sundays as a half day and Saturdays as a full day.
01/04	1.5
02/04	0.5
03/04	0
04/04	0.5
05/04	1.5
06/04	0
07/04	1.5
08/04	0.5
09/04	0
10/04	2
11/04	0
12/04	0.5
01/05	1.5
02/05	0
03/05	0
04/05	1.5
05/05	0.5
06/05	0
07/05	2
08/05	0
09/05	0.5
10/05	1.5
11/05	0
12/05	1.5
01/06	0.5
02/06	0
03/06	0.5
04/06	1.5
05/06	0
06/06	0.5
07/06	1.5
08/06	0
09/06	1.5
10/06	0.5
11/06	0
12/06	2
01/07	0
02/07	0
03/07	1.5
04/07	0.5
05/07	0
06/07	1.5
07/07	0.5
08/07	0.5
09/07	1.5
10/07	0
11/07	0.5
12/07	1.5
01/08	0
02/08	0.5
03/08	1.5
04/08	0
05/08	1.5
06/08	0.5
07/08	0
08/08	2
09/08	0
10/08	0.5
11/08	1.5
12/08	0
01/09	1.5
02/09	0
03/09	0.5
04/09	0
05/09	2
06/09	0
07/09	0.5
08/09	1.5
09/09	0
10/09	1.5
11/09	0.5
12/09	0
01/10	2
02/10	0
03/10	0
04/10	0.5
05/10	1.5
06/10	0
07/10	1.5
08/10	0.5
09/10	0
10/10	2
11/10	0
12/10	0.5
01/11	1.5
02/11	0
03/11	0
04/11	1.5
05/11	0.5
06/11	0
07/11	2
08/11	0
09/11	0.5
10/11	1.5
11/11	0
12/11	1.5
01/12	0.5
02/12	0
03/12	1.5
04/12	0.5
05/12	0
06/12	1.5
07/12	0.5
08/12	0.5
09/12	1.5
10/12	0
11/12	0.5
12/12	1.5
01/13	0
02/13	0
03/13	2
04/13	0
05/13	0.5
06/13	1.5
07/13	0
08/13	1.5
09/13	0.5
10/13	0
11/13	1.5
12/13	0.5
01/14	0.5
02/14	0
03/14	1.5
04/14	0
05/14	1.5
06/14	0.5
07/14	0
08/14	2
09/14	0
10/14	0.5
11/14	1.5
12/14	0
01/15	1.5
02/15	0
03/15	0.5
04/15	0
05/15	2
06/15	0
07/15	0.5
08/15	1.5
09/15	0
10/15	1.5
11/15	0.5
12/15	0
01/16	2
02/16	0
03/16	0
04/16	1.5
05/16	0.5
06/16	0
07/16	2
08/16	0
09/16	0.5
10/16	1.5
11/16	0
12/16	1.5
01/17	0.5
02/17	0
03/17	0.5
04/17	1.5
05/17	0
06/17	0.5
07/17	1.5
08/17	0
09/17	1.5
10/17	0.5
11/17	0
12/17	2
01/18	0
02/18	0
03/18	1.5
04/18	0.5
05/18	0
06/18	1.5
07/18	0.5
08/18	0.5
09/18	1.5
10/18	0
11/18	0.5
12/18	1.5
01/19	0
02/19	0
03/19	2
04/19	0
05/19	0.5
06/19	1.5
07/19	0
08/19	1.5
09/19	0.5
10/19	0
11/19	1.5
12/19	0.5
01/20	0.5
02/20	1
03/20	0.5
04/20	0
05/20	2
06/20	0
07/20	0.5
08/20	1.5
09/20	0
10/20	1.5
11/20	0.5
12/20	0
01/21	2
02/21	0
03/21	0
04/21	0.5
05/21	1.5
06/21	0
07/21	1.5
08/21	0.5
09/21	0
10/21	2
11/21	0
12/21	0.5
01/22	1.5
02/22	0
03/22	0
04/22	1.5
05/22	0.5
06/22	0
07/22	2
08/22	0
09/22	0.5
10/22	1.5
11/22	0
12/22	1.5
01/23	0.5
02/23	0
03/23	0.5
04/23	1.5
05/23	0
06/23	0.5
07/23	1.5
08/23	0
09/23	1.5
10/23	0.5
11/23	0
12/23	2
01/24	0
02/24	0
03/24	2
04/24	0
05/24	0.5
06/24	1.5
07/24	0
08/24	1.5
09/24	0.5
10/24	0
11/24	1.5
12/24	0.5
01/25	0.5
02/25	0
03/25	1.5
04/25	0
05/25	1.5
06/25	0.5
07/25	0
08/25	2
09/25	0
10/25	0.5
11/25	1.5
12/25	0
I noticed that months with five Fri, Sat, and Sun only happen about once a year.
link to original post
Im using python to collect/manipulate the data, output a csv and then copy/paste into the website "flourish." Ill was thinking the same thing about weighting Saturday heavier than friday/sunday.
One thing im wondering about this entire theory... do many casinos have penny denomination video poker in any significant capacity?
Quote: VegasEducation
One thing im wondering about this entire theory... do many casinos have penny denomination video poker in any significant capacity?
No. You can find 5 cent VP but casinos don't like it. When you are offering video poker the payback is usually between 95% and 99% so they want larger bets because the payback is so high. When a typical casino floor average 90%-92% they don't like offering many 95% and up games. Video poker is slowly being fazed out as they don't want to give up floor space that they can set at 90% with video poker.
Quote: DRichQuote: VegasEducation
One thing im wondering about this entire theory... do many casinos have penny denomination video poker in any significant capacity?
No. You can find 5 cent VP but casinos don't like it. When you are offering video poker the payback is usually between 95% and 99% so they want larger bets because the payback is so high. When a typical casino floor average 90%-92% they don't like offering many 95% and up games. Video poker is slowly being fazed out as they don't want to give up floor space that they can set at 90% with video poker.
link to original post
Unless im missing something, that seems to destroy this whole weekend theory. Weekends do seem like they have some level of correlation. My thought is that they are somehow involving total revenue in calculating win-rate. With more weekends, revenue would be higher
Lack of penny VP probably shows that video poker is not the primary factor causing the RTP to differ from one month to the next. I have suggested crowding out or customer preferences might have an effect on weekend RTP. If I read your graphs right, the correlation between Saturdays and RTP is positive. When I first posited this explanation, I did not even know if the correlation was positive or negative. So this is a useful bit of information you unearthed. A positive correlation means people are getting a better return in months that have more Saturdays.Quote: VegasEducationQuote: DRichQuote: VegasEducation
One thing im wondering about this entire theory... do many casinos have penny denomination video poker in any significant capacity?
No. You can find 5 cent VP but casinos don't like it. When you are offering video poker the payback is usually between 95% and 99% so they want larger bets because the payback is so high. When a typical casino floor average 90%-92% they don't like offering many 95% and up games. Video poker is slowly being fazed out as they don't want to give up floor space that they can set at 90% with video poker.
link to original post
Unless im missing something, that seems to destroy this whole weekend theory. Weekends do seem like they have some level of correlation. My thought is that they are somehow involving total revenue in calculating win-rate. With more weekends, revenue would be higher
link to original post
I know you probably spent a fair amount of time scraping this data from the NV web sites. I don't want to reproduce that effort. I might pick a different state and scrape similar data. I would then use a spreadsheet to calculate the correlation coefficient versus any factor I can think of that might cause RTP to fluctuate. If the correlation is almost perfect, then we know it is a weekend effect, but we still might not know the primary cause.
You mentioned total revenue. I assume you don't mean that non-gaming revenue is included in the reported numbers. DarkOz suggested that promotional money would be mingled with the numbers, but this would muddy the waters further. I think these numbers were defined purely as coin-out/coin-in in the old terminology. The reports are required by statute and are meant to reflect basic game RTP.
https://www.mgc.dps.mo.gov/Casino_Gaming/rb_financials/rb_Fin_main.html
The RTP does not change much from Jan to Dec 2023:
90.38%
90.23%
90.24%
90.24%
90.29%
90.26%
90.29%
90.30%
90.27%
90.30%
90.40%
90.33%
In the MO commission reports, ACTUAL PAYOUT is calculated as 1 - (SLOT AGR / SLOT HANDLE). The MO data has a breakdown of RTP by denomination, but I did not look into this.
The NV RTPs vary by ten times as much as the MO RTPs. Maybe NV compiles their data on a 4-5-4 calendar? Something is making the NV data bounce around on a three month cycle.
Im working on graphing the revenue. I wont be able to post it until i get home from work but there is near perfect negative correlation between "win amount" on the penny machines and "win rate" on the penny machines.
Quote: MentalI looked at the total RTP (actual payout) for last year from the Missouri Gaming Commission.
https://www.mgc.dps.mo.gov/Casino_Gaming/rb_financials/rb_Fin_main.html
The RTP does not change much from Jan to Dec 2023:
90.38%
90.23%
90.24%
90.24%
90.29%
90.26%
90.29%
90.30%
90.27%
90.30%
90.40%
90.33%
In the MO commission reports, ACTUAL PAYOUT is calculated as 1 - (SLOT AGR / SLOT HANDLE). The MO data has a breakdown of RTP by denomination, but I did not look into this.
The NV RTPs vary by ten times as much as the MO RTPs. Maybe NV compiles their data on a 4-5-4 calendar? Something is making the NV data bounce around on a three month cycle.
link to original post
Wouldn't that fall in line with my explanation a few posts above?
Quote: darkozQuote: MentalI looked at the total RTP (actual payout) for last year from the Missouri Gaming Commission.
https://www.mgc.dps.mo.gov/Casino_Gaming/rb_financials/rb_Fin_main.html
The RTP does not change much from Jan to Dec 2023:
90.38%
90.23%
90.24%
90.24%
90.29%
90.26%
90.29%
90.30%
90.27%
90.30%
90.40%
90.33%
In the MO commission reports, ACTUAL PAYOUT is calculated as 1 - (SLOT AGR / SLOT HANDLE). The MO data has a breakdown of RTP by denomination, but I did not look into this.
The NV RTPs vary by ten times as much as the MO RTPs. Maybe NV compiles their data on a 4-5-4 calendar? Something is making the NV data bounce around on a three month cycle.
link to original post
Wouldn't that fall in line with my explanation a few posts above?
link to original post
If im understanding your theory, you are thinking more or less days in the month would change the rtp? I cant see it. Itd be 29 days of 90.2% rtp or 32 days of 90.2% rtp.
For it to be explained by the days of the week, the only way that would make sense to me is the collect the coin-in info on one day of the week and the revenue on a different day. If the coin-in had extra days compared to the revenue, itd totally throw off the calculations to be high one month and low the next month. Thats IS what we see, but why would they collect different pieces of data on different days of the week?
Quote: MentalYou mentioned total revenue. I assume you don't mean that non-gaming revenue is included in the reported numbers. DarkOz suggested that promotional money would be mingled with the numbers, but this would muddy the waters further. I think these numbers were defined purely as coin-out/coin-in in the old terminology. The reports are required by statute and are meant to reflect basic game RTP.
link to original post
NGC-31 is coin in, drop, and gross revenue for slots.
Quote: VegasEducationQuote: darkozQuote: MentalI looked at the total RTP (actual payout) for last year from the Missouri Gaming Commission.
https://www.mgc.dps.mo.gov/Casino_Gaming/rb_financials/rb_Fin_main.html
The RTP does not change much from Jan to Dec 2023:
90.38%
90.23%
90.24%
90.24%
90.29%
90.26%
90.29%
90.30%
90.27%
90.30%
90.40%
90.33%
In the MO commission reports, ACTUAL PAYOUT is calculated as 1 - (SLOT AGR / SLOT HANDLE). The MO data has a breakdown of RTP by denomination, but I did not look into this.
The NV RTPs vary by ten times as much as the MO RTPs. Maybe NV compiles their data on a 4-5-4 calendar? Something is making the NV data bounce around on a three month cycle.
link to original post
Wouldn't that fall in line with my explanation a few posts above?
link to original post
If im understanding your theory, you are thinking more or less days in the month would change the rtp? I cant see it. Itd be 29 days of 90.2% rtp or 32 days of 90.2% rtp.
For it to be explained by the days of the week, the only way that would make sense to me is the collect the coin-in info on one day of the week and the revenue on a different day. If the coin-in had extra days compared to the revenue, itd totally throw off the calculations to be high one month and low the next month. Thats IS what we see, but why would they collect different pieces of data on different days of the week?
link to original post
Then I don�t understand the Saturday theory which is basically the same thing.
I don't think Saturdays specifically are higher RTP than a Thursday and certainly not say a July 4th Thursday.
Quote: darkozQuote: VegasEducationQuote: darkozQuote: MentalI looked at the total RTP (actual payout) for last year from the Missouri Gaming Commission.
https://www.mgc.dps.mo.gov/Casino_Gaming/rb_financials/rb_Fin_main.html
The RTP does not change much from Jan to Dec 2023:
90.38%
90.23%
90.24%
90.24%
90.29%
90.26%
90.29%
90.30%
90.27%
90.30%
90.40%
90.33%
In the MO commission reports, ACTUAL PAYOUT is calculated as 1 - (SLOT AGR / SLOT HANDLE). The MO data has a breakdown of RTP by denomination, but I did not look into this.
The NV RTPs vary by ten times as much as the MO RTPs. Maybe NV compiles their data on a 4-5-4 calendar? Something is making the NV data bounce around on a three month cycle.
link to original post
Wouldn't that fall in line with my explanation a few posts above?
link to original post
If im understanding your theory, you are thinking more or less days in the month would change the rtp? I cant see it. Itd be 29 days of 90.2% rtp or 32 days of 90.2% rtp.
For it to be explained by the days of the week, the only way that would make sense to me is the collect the coin-in info on one day of the week and the revenue on a different day. If the coin-in had extra days compared to the revenue, itd totally throw off the calculations to be high one month and low the next month. Thats IS what we see, but why would they collect different pieces of data on different days of the week?
link to original post
Then I don�t understand the Saturday theory which is basically the same thing.
I don't think Saturdays specifically are higher RTP than a Thursday and certainly not say a July 4th Thursday.
link to original post
I agree with you fully. It was hard for me to believe RTP could be THAT different because of one extra weekend of we are including video poker. Its not like theres 4 Saturdays one month and 87 Saturdays the next month. Then, throw in that theres no penny denomination video poker.... how can player behavior effect RTP THAT much with no video poker and 1 extra weekend. Ill graph it and experiment with it for the sake of being complete, but i dont believe its the reason
My current theory is that I think that they are estimating the RTP by using a formula that includes revenue. So, i think we'll see weekends correlate because more weekends means more revenue.
Quote: itsmejeffQuote: MentalYou mentioned total revenue. I assume you don't mean that non-gaming revenue is included in the reported numbers. DarkOz suggested that promotional money would be mingled with the numbers, but this would muddy the waters further. I think these numbers were defined purely as coin-out/coin-in in the old terminology. The reports are required by statute and are meant to reflect basic game RTP.
link to original post
NGC-31 is coin in, drop, and gross revenue for slots.
link to original post
Are the coin-in and drop numbers collected electronically and remotely in real time now?
Or are they really doing a physical drop before these numbers get entered on the report?
Are the numbers meant to be recorded on the last gaming day of the month no matter what day of the week that falls on?
The drop could be messing up the numbers if coin in and coin out are not recorded on the same time frame each month.
Quote: Mental
Or are they really doing a physical drop before these numbers get entered on the report?
That is a very good question. If they are using the coin in and coin out numbers from the electronic reporting but using the win numbers based on the actual win computed after physical drop that could cause some discrepancies. Some casinos will only do the physical drop once per week per machine so the actual win may be getting reported up to seven days late..
One observation I made is that on the chart with the number of Saturdays graphed, it seemed to be negatively correlated between 2009 and 2011 and positively correlated on the rest. This makes me think the correlation on there is just a coincidence. If we look at the total vs win-rate chart, its negatively correlated through that section. There's sections that it doesn't seem to show much correlation, but it never flip flops from negative to positive.
Quote: VegasEducationHere is the correlation between penny denomination win-rate and total. The win-rate number is accurate to the reports. I did some math to the total to make the range fit on the chart. So, the shape of the chart is accurate but the numbers next to total are completely irrelevant.
One observation I made is that on the chart with the number of Saturdays graphed, it seemed to be negatively correlated between 2009 and 2011 and positively correlated on the rest. This makes me think the correlation on there is just a coincidence. If we look at the total vs win-rate chart, its negatively correlated through that section. There's sections that it doesn't seem to show much correlation, but it never flip flops from negative to positive.
link to original post
I still don't think it's Saturdays but 2009 -2011 were the 2008 recession years. When discretionary spending dropped so bad even the sex trade was affected.
Any possibility that is the reason for the anomaly?
Quote: darkozQuote: VegasEducationHere is the correlation between penny denomination win-rate and total. The win-rate number is accurate to the reports. I did some math to the total to make the range fit on the chart. So, the shape of the chart is accurate but the numbers next to total are completely irrelevant.
One observation I made is that on the chart with the number of Saturdays graphed, it seemed to be negatively correlated between 2009 and 2011 and positively correlated on the rest. This makes me think the correlation on there is just a coincidence. If we look at the total vs win-rate chart, its negatively correlated through that section. There's sections that it doesn't seem to show much correlation, but it never flip flops from negative to positive.
link to original post
I still don't think it's Saturdays but 2009 -2011 were the 2008 recession years. When discretionary spending dropped so bad even the sex trade was affected.
Any possibility that is the reason for the anomaly?
link to original post
Thats a very good point. It does seem a bit too much to be a coincidence that its the exact time of the recession. Its odd that the total doesnt reflect the recession in the same way
I only looked at the first table 'Statewide - All Nonrestricted Locations'.
When I graph the return data, I do not see the oscillations that you are reporting. Can you spot check your data and make sure what you are plotting reflects the actual values in the report? There is always the possibility that your extraction tools are creating an artifact in the plots. However, I have not yet extracted the specific tables that you are reporting on and I have no specific reason to think your data is wrong.
I am using pdfgrep and unix utilities to do the data extraction.
Quote: MentalThanks. I will try to check my own extraction method. We should be able to agree on the raw data, so maybe I am pulling out a different part of the table.
link to original post
They do seem to be more scattered in the last couple years. That might be the difference you are seeing
Quote: MentalThanks. I will try to check my own extraction method. We should be able to agree on the raw data, so maybe I am pulling out a different part of the table. I was a bit rushed when I did this because my SO needs me to go out shopping for furniture today.
link to original post
Heres the folder with the reports. The data you looking for is in a subfolder called "data." I dont know that the "total gaming win" is accurate, but the rest should be
https://drive.google.com/drive/folders/17Dw6e73xxcP487-Fq4lYScWM7JARwbmd
I looked at my extractor and realized that I was pulling out the 12-month average RTP column. Of course it is smoother than your data. I will fix this and look into your data dump tomorrow. I downloaded your XLS files.Quote: VegasEducationQuote: MentalThanks. I will try to check my own extraction method. We should be able to agree on the raw data, so maybe I am pulling out a different part of the table. I was a bit rushed when I did this because my SO needs me to go out shopping for furniture today.
link to original post
Heres the folder with the reports. The data you looking for is in a subfolder called "data." I dont know that the "total gaming win" is accurate, but the rest should be
https://drive.google.com/drive/folders/17Dw6e73xxcP487-Fq4lYScWM7JARwbmd
link to original post
Thanks for sharing.
I fixed my data extractor to extract the unaveraged monthly data. Now my values match your values going back to June 2021. But, I believe you have a glitch affecting the data for April and May 2021. The same values appear for consecutive months. I have not cross-checked any data prior to April 2021. I will assume that the data is accurate except for a few possible glitches that don't affect the discussion.Quote: MentalI looked at my extractor and realized that I was pulling out the 12-month average RTP column. Of course it is smoother than your data. I will fix this and look into your data dump tomorrow. I downloaded your XLS files.Quote: VegasEducationQuote: MentalThanks. I will try to check my own extraction method. We should be able to agree on the raw data, so maybe I am pulling out a different part of the table. I was a bit rushed when I did this because my SO needs me to go out shopping for furniture today.
link to original post
Heres the folder with the reports. The data you looking for is in a subfolder called "data." I dont know that the "total gaming win" is accurate, but the rest should be
https://drive.google.com/drive/folders/17Dw6e73xxcP487-Fq4lYScWM7JARwbmd
link to original post
Thanks for sharing.
link to original post
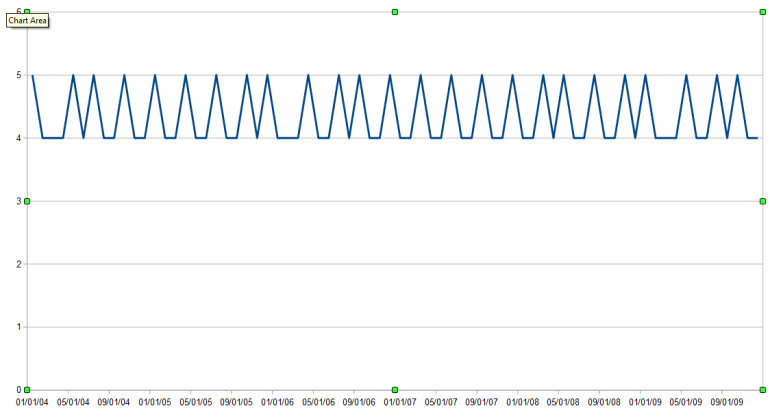
I created a graph comparing the Slot Machine Total Win% data to the number of Saturdays in month. I subtracted the raw Win data from the constant 7.5 so it represents the extra RTP above a floor of 92.5%. I multiplied the number of Saturdays in a month by a factor of two and subtracted off 8 days so the two curves were scaled similarly. The grid line spacing is 0.5% RTP or 0.25 Saturdays.
I created two charts to cover the range 2004-2020 because it is hard to see the correlation if I squish the range into one chart. I also wanted to avoid the pandemic era effects. In order to check for correlation, look at the most extreme upward spikes in the blue RTP curve. I suggest you count the fraction of these spikes that coincide exactly with months that have five Saturdays (the peaks on the red curve). I have done this for myself, but I don't want to bias your own analysis.
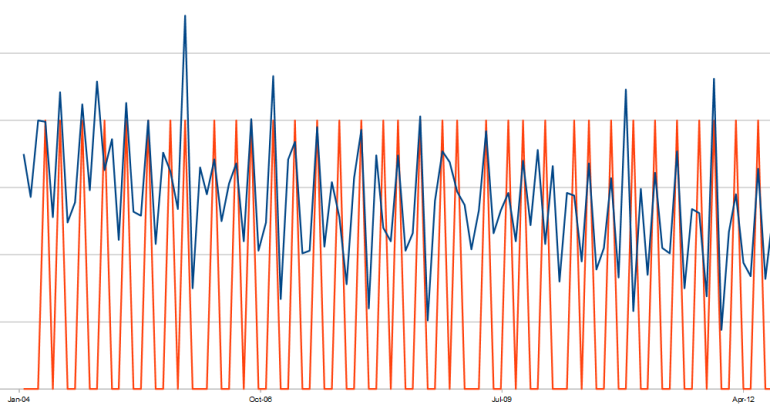
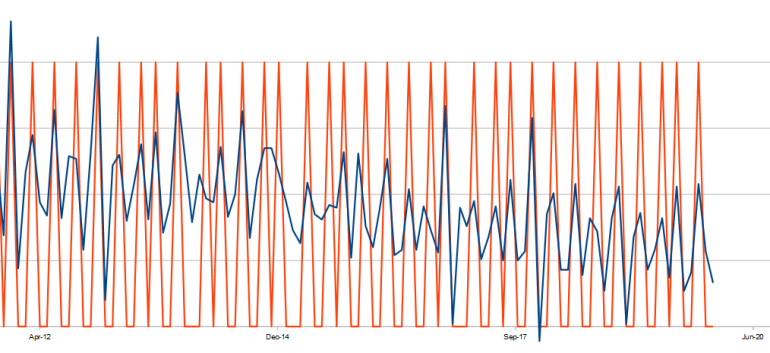
I also calculated the correlation of the two curves over a sliding 24-month window. The correlation is generally moderate or very high. It is never low or negative in any 24-month period. I think this proves that the calendar is causing the periodic spikes in the reported slot win. I no longer believe that these are real changes in RTP. I think this is an artifact of how the reports are created. If the month ends near a fifth Saturday, the reported slot win tends to be lower.
Quote: MentalI fixed my data extractor to extract the unaveraged monthly data. Now my values match your values going back to June 2021. But, I believe you have a glitch affecting the data for April and May 2021. The same values appear for consecutive months. I have not cross-checked any data prior to April 2021. I will assume that the data is accurate except for a few possible glitches that don't affect the discussion.Quote: MentalI looked at my extractor and realized that I was pulling out the 12-month average RTP column. Of course it is smoother than your data. I will fix this and look into your data dump tomorrow. I downloaded your XLS files.Quote: VegasEducationQuote: MentalThanks. I will try to check my own extraction method. We should be able to agree on the raw data, so maybe I am pulling out a different part of the table. I was a bit rushed when I did this because my SO needs me to go out shopping for furniture today.
link to original post
Heres the folder with the reports. The data you looking for is in a subfolder called "data." I dont know that the "total gaming win" is accurate, but the rest should be
https://drive.google.com/drive/folders/17Dw6e73xxcP487-Fq4lYScWM7JARwbmd
link to original post
Thanks for sharing.
link to original post
I created a graph comparing the Slot Machine Total Win% data to the number of Saturdays in month. I subtracted the raw Win data from the constant 7.5 so it represents the extra RTP above a floor of 92.5%. I multiplied the number of Saturdays in a month by a factor of two and subtracted off 8 days so the two curves were scaled similarly. The grid line spacing is 0.5% RTP or 0.25 Saturdays.
I created two charts to cover the range 2004-2020 because it is hard to see the correlation if I squish the range into one chart. I also wanted to avoid the pandemic era effects. In order to check for correlation, look at the most extreme upward spikes in the blue RTP curve. I suggest you count the fraction of these spikes that coincide exactly with months that have five Saturdays (the peaks on the red curve). I have done this for myself, but I don't want to bias your own analysis.
I also calculated the correlation of the two curves over a sliding 24-month window. The correlation is generally moderate or very high. It is never low or negative in any 24-month period. I think this proves that the calendar is causing the periodic spikes in the reported slot win. I no longer believe that these are real changes in RTP. I think this is an artifact of how the reports are created. If the month ends near a fifth Saturday, the reported slot win tends to be lower.
link to original post
So it's more what I thought. Not Saturdays but design flaw of the collection process.
See my OP 4th paragraph down.
Even if it's not due to extra days in the month I suspected all along it was the collection process itself skewing.

Quote: MentalI fixed my data extractor to extract the unaveraged monthly data. Now my values match your values going back to June 2021. But, I believe you have a glitch affecting the data for April and May 2021. The same values appear for consecutive months. I have not cross-checked any data prior to April 2021. I will assume that the data is accurate except for a few possible glitches that don't affect the discussion.Quote: MentalI looked at my extractor and realized that I was pulling out the 12-month average RTP column. Of course it is smoother than your data. I will fix this and look into your data dump tomorrow. I downloaded your XLS files.Quote: VegasEducationQuote: MentalThanks. I will try to check my own extraction method. We should be able to agree on the raw data, so maybe I am pulling out a different part of the table. I was a bit rushed when I did this because my SO needs me to go out shopping for furniture today.
link to original post
Heres the folder with the reports. The data you looking for is in a subfolder called "data." I dont know that the "total gaming win" is accurate, but the rest should be
https://drive.google.com/drive/folders/17Dw6e73xxcP487-Fq4lYScWM7JARwbmd
link to original post
Thanks for sharing.
link to original post
I created a graph comparing the Slot Machine Total Win% data to the number of Saturdays in month. I subtracted the raw Win data from the constant 7.5 so it represents the extra RTP above a floor of 92.5%. I multiplied the number of Saturdays in a month by a factor of two and subtracted off 8 days so the two curves were scaled similarly. The grid line spacing is 0.5% RTP or 0.25 Saturdays.
I created two charts to cover the range 2004-2020 because it is hard to see the correlation if I squish the range into one chart. I also wanted to avoid the pandemic era effects. In order to check for correlation, look at the most extreme upward spikes in the blue RTP curve. I suggest you count the fraction of these spikes that coincide exactly with months that have five Saturdays (the peaks on the red curve). I have done this for myself, but I don't want to bias your own analysis.
I also calculated the correlation of the two curves over a sliding 24-month window. The correlation is generally moderate or very high. It is never low or negative in any 24-month period. I think this proves that the calendar is causing the periodic spikes in the reported slot win. I no longer believe that these are real changes in RTP. I think this is an artifact of how the reports are created. If the month ends near a fifth Saturday, the reported slot win tends to be lower.
link to original post
Awesome work! I'm trying to wrap my head around what you did. When you said "raw win data," you are talking about the "win-rate" on the report of what should be 100- RTP? What is the constant of 7.5? 7.5 is because you want you data to fall on a chart with the lowest Y-value of 92.5?
Your chart definitely does show an obscene amout of correlation. Have you tried looking at the "win-total" vs "win-rate?"
In my mind, the two theories that make the most sense right now are
1. Something about the end of the month falling near a 5th weekend and that's when they issue the calculate the reports
2. The win-rate is calculated from the revenue and months with more weekends have higher revenue
And yes. There very well could be bugs in my code making numbers off here and there. The bulk of them should be pretty accurate. I spent a lot of time manually checking over the bulk of them but i was looking at many different areas on the report. Also, my code is incredibly inefficient. I might try to present myself as some kind of programmer or statistician but im far from it. Im an electrician with very basic knowledge in python. The work you did in the last 24 hours took me months to accomplish 🤣
I wrote a script to change the Nevada PDF file names to a numeric format using sed within a bash loop. This makes it easier to loop through the months in chronological order.
Then, I figured out how to convert the PDF to text, match the first instance of the denomination, then cut out the correct column. For example, the January and February 2024 penny slot win values are extracted with these command lines.
$ pdfgrep ' ' 24_01-gri.pdf | grep -m1 '1 Cent' | cut -c106-112
10.80
$ pdfgrep ' ' 24_02-gri.pdf | grep -m1 '1 Cent' | cut -c107-112
9.32
This takes just one millisecond per month per denomination.
Quote: MentalI don't use python much because I was using awk before perl and python were invented. I wish I knew python better.
I wrote a script to change the Nevada PDF file names to a numeric format using sed within a bash loop. This makes it easier to loop through the months in chronological order.
Then, I figured out how to convert the PDF to text, match the first instance of the denomination, then cut out the correct column. For example, the January and February 2024 penny slot win values are extracted with these command lines.
$ pdfgrep ' ' 24_01-gri.pdf | grep -m1 '1 Cent' | cut -c106-112
10.80
$ pdfgrep ' ' 24_02-gri.pdf | grep -m1 '1 Cent' | cut -c107-112
9.32
This takes just one millisecond per month per denomination.
link to original post
The way i did it, i downloaded all the pdfs into a folder. Then i looped through all of them, renaming their months to numbers and ran through my renaming script to get them all to the names to "yyyy mm" so that they could be read alpha numerically in order.
Then made another script to extract each page to a folder. So i have a "page 14" folder with files for every date.
Then made another script to convert all the pdfs from 2004 to 2018 to a csv.
Then made another script to convert the 2018 to present to csv
Then made another script to extract the data i want and format it into the final xlxs and formatted how i want.
Every step of this was basically a separate project to figure out as i had no idea how to do a lot of it
What did you use to convert PDF to text? I tried xpdf, but it depends on Qt, and my Qt install is broken. So I tried pdfgrep as a substitute, and it worked well.Quote: VegasEducationQuote: MentalI don't use python much because I was using awk before perl and python were invented. I wish I knew python better.
I wrote a script to change the Nevada PDF file names to a numeric format using sed within a bash loop. This makes it easier to loop through the months in chronological order.
Then, I figured out how to convert the PDF to text, match the first instance of the denomination, then cut out the correct column. For example, the January and February 2024 penny slot win values are extracted with these command lines.
$ pdfgrep ' ' 24_01-gri.pdf | grep -m1 '1 Cent' | cut -c106-112
10.80
$ pdfgrep ' ' 24_02-gri.pdf | grep -m1 '1 Cent' | cut -c107-112
9.32
This takes just one millisecond per month per denomination.
link to original post
The way i did it, i downloaded all the pdfs into a folder. Then i looped through all of them, renaming their months to numbers and ran through my renaming script to get them all to the names to "yyyy mm" so that they could be read alpha numerically in order.
Then made another script to extract each page to a folder. So i have a "page 14" folder with files for every date.
Then made another script to convert all the pdfs from 2004 to 2018 to a csv.
Then made another script to convert the 2018 to present to csv
Then made another script to extract the data i want and format it into the final xlxs and formatted how i want.
Every step of this was basically a separate project to figure out as i had no idea how to do a lot of it
link to original post
I hope you can recycle some of what you learned on this project.