
Do you WinCrap?
Thread Rating:
Has anyone ran single or multiple shooter simulations and if so how many "Points-in-a-row" have you seen from your simulation?
If you've ever captured that data, can you share it with us? :)
Some day, some one will look in the mirror and witness a CPT violation. In this universe, before time ends, some one will throw 18 yos in a row for real.
How many has the simulator shown possible at 1B, or 100M decisions?
I've actually thrown 6 points myself more than once (got the fire @250-1) and have "seen" 7 points as well. Never 8. What have you seen, or thrown, yourself?
Last night I wrote a second risk level to my system because weekends are pretty harsh out here. Well I went into the lions den armed with a tool that offset my risk by 2 standard deviations and it was a cakewalk to say the least. 1 SD would have done it. Ill keep them both. I now believe I have the ability to overcome my variance and that is the last piece of the puzzle. (I got the ALL too, one roll got 8 for the point 3 times and got them all, next round I got 5 for the point 3 times and got them all) that was messed up!
The changing SD is easy to program and I figured that out. But how could you program something to simulate a slow Mon/Tue/Wed in a casino, a pickup on Thu, rock and roll Fri/Sat/Sun, then back to the Monday grind?
How about big holidays? Can those be simulated? Because the way I see it we have about 27 million new years eves to deal with here and I might want to ditch or take the drunks money who knows at this time?
Can we program an AI to pick up a pattern on new years eve(s) say after the first 100,000 new years eves?
Because in real life there are reasons for altering our systems to account for variance, but I don't think any of these reasons can be simulated.
Anyone have any thoughts?
Quote: rushdlIf so ...
Has anyone ran single or multiple shooter simulations and if so how many "Points-in-a-row" have you seen from your simulation?
If you've ever captured that data, can you share it with us? :)
WinCraps tracks a lot of data but obviously it can't track everything. No matter how much data you gather, there's always something that can be thought of that's not included. However, it's a simple matter to write a script to capture the data you want.
On my site is a free script titled "passes in a row" which can easily be modified to capture points in a row. For example, I've modified the code listed below to do just that. You can copy and paste it into WinCraps:
If beginning new session Then
   cs0.count = 0 :
   csn0.#ofstreaks = 0
EndIf

If a point is decided FOR any(4, 5, 6, 8, 9, 10) Then
   add 1 to cs0.count

ElseIf seven out Then
   If cs0.count > 0 Then
      csn0.#ofstreaks = val(csn0.#ofstreaks) + 1 & " streaks" :
      add 1 to cs(cs0.count) :
      csn(cs0.count) = 100 * cs(cs0.count) / val(csn0.#ofstreaks) & "%" :
      cs0.count = 0
   EndIf
EndIf
I ran this script for 1 million rolls and here are my results:
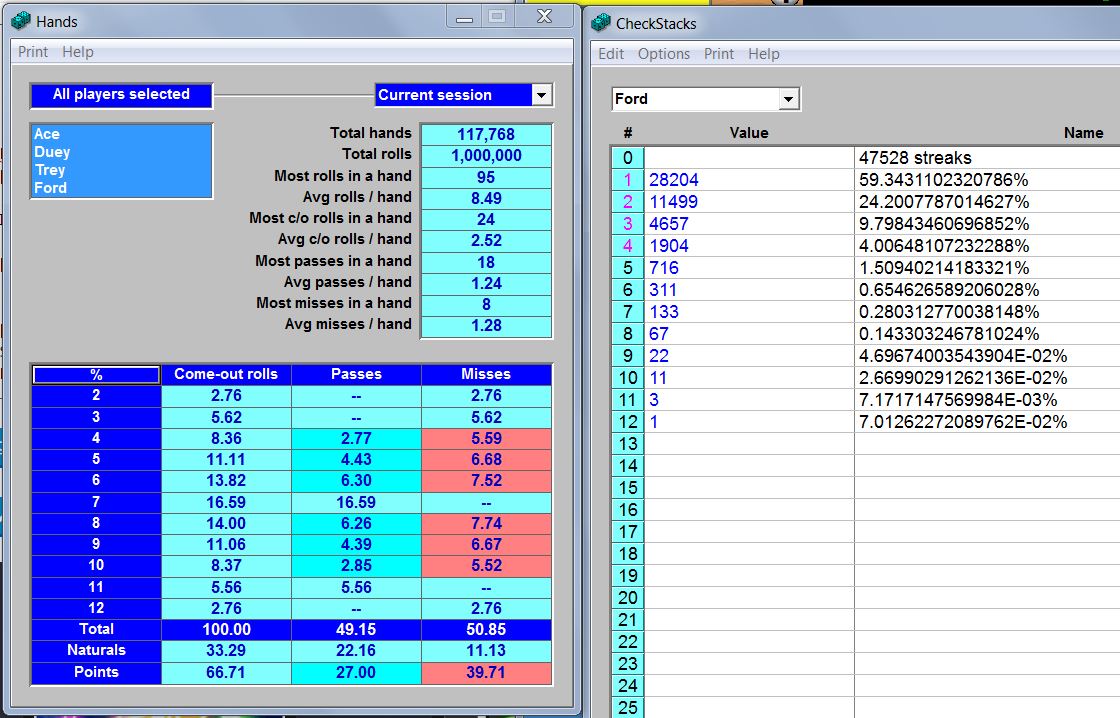
On the right side of the image is the output of the auto-bet script. Each checkstack represents streaks of "points in a row". For example, there were 311 instances (streaks) of 6 points in a row (comprising 0.65% of the 47528 streaks detected). The longest streak was one instance of 12 points in a row.
Of course, the results depend on how you define your streaks. In this case, streaks can include come-out winners and losers. If your definition of points in a row does not include come-out winners and losers then you might change the code above to end streaks on "shooter misses" instead of "seven out" or whatever else might you might fancy.
Quote: rushdl
Some day, some one will look in the mirror and witness a CPT violation. In this universe, before time ends, some one will throw 18 yos in a row for real.
How many has the simulator shown possible at 1B, or 100M decisions?
The longer you run your simulations, the more likely you are to encounter longer streaks.
Quote: rushdl
The changing SD is easy to program and I figured that out. But how could you program something to simulate a slow Mon/Tue/Wed in a casino, a pickup on Thu, rock and roll Fri/Sat/Sun, then back to the Monday grind?
How about big holidays? Can those be simulated? Because the way I see it we have about 27 million new years eves to deal with here and I might want to ditch or take the drunks money who knows at this time?
By starting a new session for each streak, you can easily use WinCraps to plot a histogram of streaks. For example, try this code:
If beginning new session Then
   cs0.count = 0
EndIf

If a point is decided FOR any(4, 5, 6, 8, 9, 10) Then
   add 1 to cs0.count

ElseIf seven out Then
   start new session
EndIf
On the Sessions Log, select checkstack0 to see the histogram of points-in-a-row streaks. Note however, that this includes streaks of zero (no points made during a hand). If you'd rather just measure streaks of length one or more, then try this code:
If beginning new session Then
   cs0.count = 0
EndIf

If a point is decided FOR any(4, 5, 6, 8, 9, 10) Then
   add 1 to cs0.count

ElseIf seven out Then
   If cs0.count > 0 Then
      start new session
   EndIf
EndIf
Here's a histogram of 101,974 sessions (streaks) which I just ran:
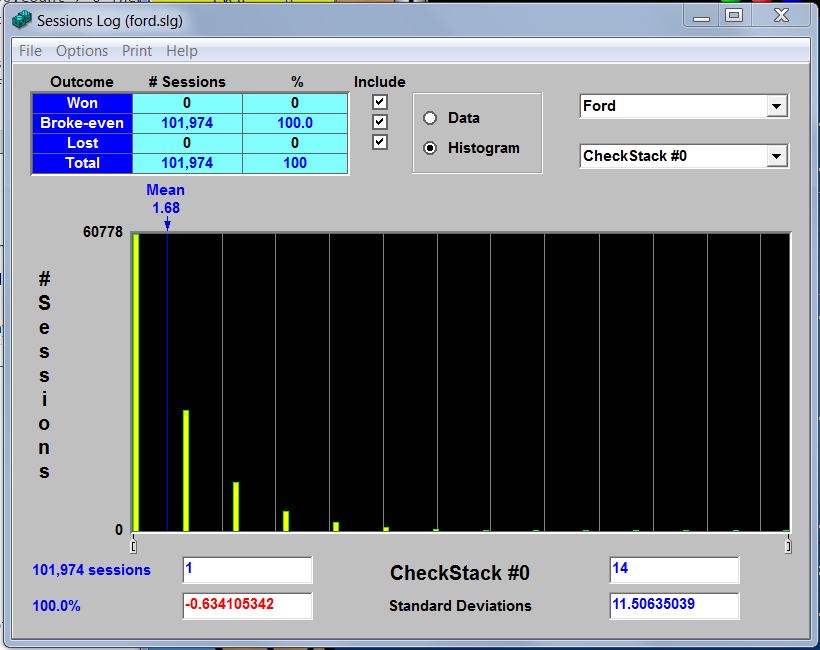
Given that it measures streaks of one of more points in a row, it yielded an average streak length of 1.68.
Quote: rushdlCan we program an AI to pick up a pattern on new years eve(s) say after the first 100,000 new years eves?
Because in real life there are reasons for altering our systems to account for variance, but I don't think any of these reasons can be simulated.
Anyone have any thoughts?
The simulator is but a tool. The data you reap is a factor of how you use the tool. Are the things you mentioned real, detectable, quantifiable, etc? If so, then you should be able to program it to exploit them.
Steen
I used tooQuote: rushdlIf so ...
i due have someQuote: rushdlHas anyone ran single or multiple shooter simulations and if so how many "Points-in-a-row" have you seen from your simulation?
10 million dice rolls
here is a pic of the distribution next to the expected probabilities (easy to calculate)
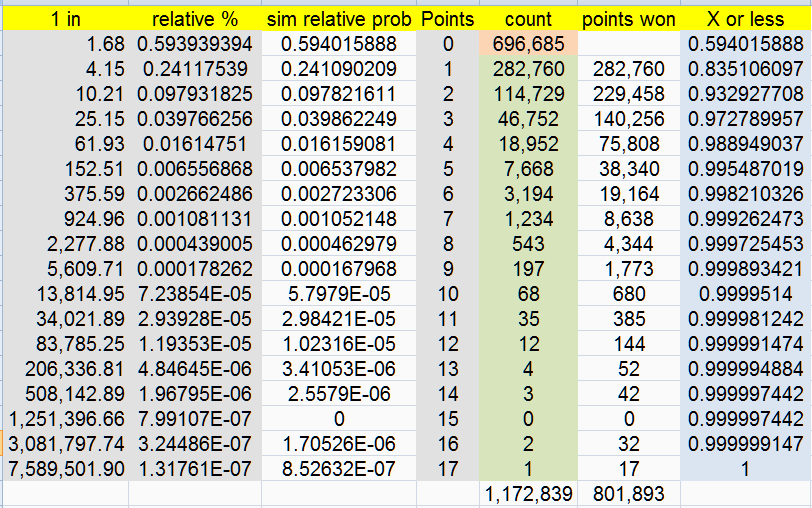
6 points is excellent!Quote: rushdlI've actually thrown 6 points myself more than once (got the fire @250-1) and have "seen" 7 points as well. Never 8.
I mean, the average is only 0.68
less than 1
of course 6 out of 10 shooters
do not hit any points on an average
I hit 8 points once. happened real fast too.
abouts 1 in 1,356 shooters on average hit 7 or more points
so it happens but not 10 times every day at every table
that all right-way players want
The world's record must be over 30 points in one hand
Grandma Pat (154 rolls) and the Utah Mom (163 rolls) both I would guess
were over that
but no data has even been shown from their monster rolls.
Sally