Streaks data for baccarat or roulette
Thread Rating:
I am interested in how many streaks happen per shoe/ number of hands or number of spins.
I am interested in streaks of between 2-10
For example I DO NOT consider a 2 streak as a streak of 2 or more. A streak would be exactly 2, then reset to 0. As such 4 in a row is 2 x 2 streaks, 6 in a row as 3 x 2 streaks and so on
I am not interested in ties for baccarat, roulette would be a single zero wheel.
As you may be able to tell from my other posts I am quite interested in streaks currently, any data on this subject would be appreciated.
really?Quote: DanthemanFor example I DO NOT consider a 2 streak as a streak of 2 or more.
A streak would be exactly 2, then reset to 0. As such 4 in a row is 2 x 2 streaks, 6 in a row as 3 x 2 streaks and so on
so this in Bacc
BBBBP
the most common way to count streaks (run)
to me a B run = 4 and the frequency = 1 (frequency = number of times)
P run = 1 and the frequency = 1
B run is not equal to 2 and the frequency = 2
but it could be
another example
BB BB BB BB BB BB P
the
B run = 2 and freq = 6
the run also = 12 and freq = 1
this is the way I have data
so actually larger streaks can be counted as smaller streaks
but this
BB BP
i see as a B run = 3 and freq = 1
do you see this as run = 2 and freq = 1
and run = 1 and freq = 1 for B
and P run =1 and freq = 1
the counting methods have to be the same or one counts an apple as an orange
Sally
Quote: DanthemanFor example I DO NOT consider a 2 streak as a streak of 2 or more. A streak would be exactly 2, then reset to 0. As such 4 in a row is 2 x 2 streaks, 6 in a row as 3 x 2 streaks and so on
Does that mean BBBBBB would be (3 streaks of 2) and (2 streaks of 3) and (1 streak of 6) and ([1 streak of 4] and [1 streak of 2]), for a total of 7 (or 8, still depending on how it's counted) streaks?
Quote: VenthusDoes that mean BBBBBB would be (3 streaks of 2) and (2 streaks of 3) and (1 streak of 6) and ([1 streak of 4] and [1 streak of 2]), for a total of 7 (or 8, still depending on how it's counted) streaks?
It depends on how much you wager and if you chicken out.
Quote: VenthusDoes that mean BBBBBB would be (3 streaks of 2) and (2 streaks of 3) and (1 streak of 6) and ([1 streak of 4]
Yes correct.
I would be interested to find data that would break down into 2-10 streaks
Eg BBBBBBPPBPBBBPB
2 streaks = 5
3 streaks = 3
4 streaks = 1
5 streaks =1
6 streaks = 1
If someone has a data set where each shoe is broken down this way, that is what I am looking for.
Quote: mustangsally
another example
BB BB BB BB BB BB P
the
B run = 2 and freq = 6
the run also = 12 and freq = 1
this is the way I have data
so actually larger streaks can be counted as smaller streaks
but this
BB BP
i see as a B run = 3 and freq = 1
do you see this as run = 2 and freq = 1
and run = 1 and freq = 1 for B
and P run =1 and freq = 1
the counting methods have to be the same or one counts an apple as an orange
Sally
Yes in the first example i see:
Run 2- freq 6
Run 3- freq 4
Run 4- freq 3
Run 5- freq 2
Run 6- freq 2
In the second example i see:
Run 2- freq 1
Run 3- freq 1
Im not particularly worried whether the streaks are from player or banker, more interested in the total.
301,815,490 streaks of 2
129,380,307 streaks of 3
60,396,670 streaks of 4
29,238,104 streaks of 5
14,400,732 streaks of 6
7,149,457 streaks of 7
3,564,296 streaks of 8
1,780,153 streaks of 9
890,144 streaks of 10
445,291 streaks of 11
223,464 streaks of 12
111,843 streaks of 13
56,207 streaks of 14
28,121 streaks of 15
14,157 streaks of 16
7114 streaks of 17
3624 streaks of 18
1857 streaks of 19
954 streaks of 20
461 streaks of 21
234 streaks of 22
120 streaks of 23
59 streaks of 24
25 streaks of 25
8 streaks of 26
5 streaks of 27
1 streaks of 28
1 streaks of 29
This is in line with the expected value:
The number of 3-streaks is 3/7 the number of 2-streaks
The number of 4-streaks is 7/15 the number of 3-streaks
The number of 5-streaks is 15/31 the number of 4-streaks
...
The number of N-streaks is (2N-1 - 1) / (2N - 1), or 1/2 - 1 / (2N - 2), the number of (N-1)-streaks.
As N grows, this gets closer and closer to 1/2.
Assume the two results - say, P and B - each have a probability 1/2 of occurring.
A streak of 5 is either PPPPPB or BBBBBP. However, since the last result in a streak is also the first result in a new streak, you can ignore the first result in each streak (i.e. "PPPPB" is actually a streak of five, as the first P is counted at the end of the previous streak of one or more Bs).
Thus, the probability of a streak of N occurring at any particular point is 1 / 2N.
However, a streak of N is also counted in a streak of 2N, 3N, 4N, and so on, so, for example, the probability of a streak of 2 being counted is 1/4 + 1/42 + 1/43 + 1/44 + ... = 1/4 x (1 / (1 - 1/4)) = 1/4 x 4/3 = 1/3.
The probability of a streak of N being counted is 1/2N + 1/22N + 1/23N + ... = 1/2N x (1 / (1 - 1/2N)) = 1/2N x (2N / (2N - 1)) = 1 / (2N - 1).
Thus, the ratio of streakss of N to streaks of N-1 is (1 / (2N - 1)) / (1 / (2N-1 - 1)) = (2N-1 - 1) / (2N - 1).
okQuote: DanthemanYes in the first example i see:
Run 2- freq 6
Run 3- freq 4
Run 4- freq 3
Run 5- freq 2
Run 6- freq 2
In the second example i see:
Run 2- freq 1
Run 3- freq 1
Im not particularly worried whether the streaks are from player or banker, more interested in the total.
that data can easily come from the streaks of PB runs per 8 deck shoe I posted before
my observation
by making BBB BBB
a run of 6 and 5 and 4 with freq = 1
and a run of 3 and freq=2
run of 2 and freq=3
all this from one run of 6
you create a large overlap in the data
i would like to see what you want to use this for
sure hope not a betting trigger!
==========================================
so you are really interested in a sequence of PP or BB
and their frequencies per shoe
I have that data stuff but do not know where it is
you can do this yourself too
every 3 run in a run data table adds to the PP or BB (2 run)
every 4 run adds 2* the number of 4 runs to the 2 run and so on
so i get this to start
8deck - 14 card ribbon (81.2 avg # of rounds)
i only did 1 million shoes as 100 million shoes will not have that much of an average difference that matters to me
but time does
count PP or BB (2 run)
freq=24386071
mean=24.386071
count PPP or BBB (3 run)
freq=10344683
mean=10.344683
count PPPP or BBBB (4 run)
freq=4773116
mean=4.773116
count PPPPP or BBBBB (5 run)
freq=2281898
mean=2.281898
count PPPPPP or BBBBBB (6 run)
freq=1107921
mean=1.107921
count PPPPPPP or BBBBBBB (7 run)
freq=274009
mean=0.274009
i stopped at 7
think you can finish if you want
maybe i look and see (C) what Don did
Sally
the data I have would showQuote: DanthemanI would be interested to find data that would break down into 2-10 streaks
Eg BBBBBBPPBPBBBPB
2 streaks = 5
3 streaks = 3
4 streaks = 1
5 streaks =1
6 streaks = 1
BBBBBB
PP
B
P
BBB
P
B
run1: 4
run2: 1
run3: 1
run4: 0
run5: 0
run6: 1
total runs: 7
you want it to show 11 total runs (actually sequences)
i think what you seek has never been done per shoe in a large data setQuote: DanthemanIf someone has a data set where each shoe is broken down this way, that is what I am looking for.
you may have to do this yourself
good luck and have fun
Sally
added;
there IS a free software program that can do exactly what you want
i now remember this
edit again
example
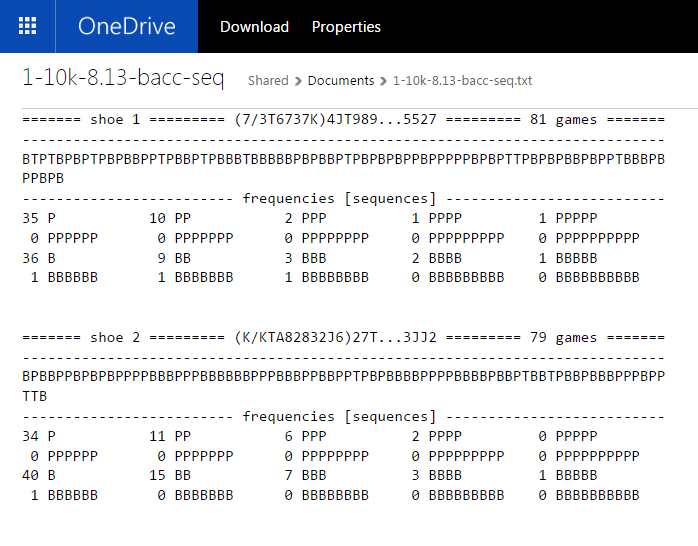
I ran 10k shoes with printout
======= shoe 10000 ======= (3/J2J)T36Q92Q95J...9355 ======= 83 games =======
----------------------------------------------------------------------------
PBPBPBPPBBPPBPPPTPBBBPBBBBPBBPTTBBBBPPPPTPBPPPTPPPBPBPBBPTPPPPBBBBTPBPBBPPPP
BBBTBBP
------------------------- frequencies [sequences] --------------------------
39 P           13 PP           6 PPP          5 PPPP         3 PPPPP
 1 PPPPPP       0 PPPPPPP      0 PPPPPPPP     0 PPPPPPPPP    0 PPPPPPPPPP
36 B           13 BB           5 BBB          4 BBBB         1 BBBBB
 0 BBBBBB       0 BBBBBBB      0 BBBBBBBB     0 BBBBBBBBB    0 BBBBBBBBBB


========================== summary [10000 shoes] ===========================
-------------------------- summary [10000 shoes] ---------------------------
------------------------- frequencies [sequences] --------------------------
363341 P           118873 PP           50094 PPP          22871 PPPP
 10816 PPPPP         5207 PPPPPP        2463 PPPPPPP       1174 PPPPPPPP
   577 PPPPPPPPP      282 PPPPPPPPPP  373232 B           124387 BB
 53308 BBB          24864 BBBB         12174 BBBBB         5999 BBBBBB
  2990 BBBBBBB       1442 BBBBBBBB       729 BBBBBBBBB      352 BBBBBBBBBB


============================================================================
decks: 8
shuffle marker: 13
time: 08:18:12.3-->08:19:19.65 (67.62)
random seed: 1530914819
it is the WinStats program by Rick Parris at Peanut Software
wow
he has been gone for almost 3 years
Quote: mustangsallyok
that data can easily come from the streaks of PB runs per 8 deck shoe I posted before
my observation
by making BBB BBB
a run of 6 and 5 and 4 with freq = 1
and a run of 3 and freq=2
run of 2 and freq=3
all this from one run of 6
you create a large overlap in the data
i would like to see what you want to use this for
sure hope not a betting trigger!
==========================================
so you are really interested in a sequence of PP or BB
and their frequencies per shoe
I have that data stuff but do not know where it is
you can do this yourself too
every 3 run in a run data table adds to the PP or BB (2 run)
every 4 run adds 2* the number of 4 runs to the 2 run and so on
so i get this to start
8deck - 14 card ribbon (81.2 avg # of rounds)
i only did 1 million shoes as 100 million shoes will not have that much of an average difference that matters to me
but time does
count PP or BB (2 run)
freq=24386071
mean=24.386071
count PPP or BBB (3 run)
freq=10344683
mean=10.344683
count PPPP or BBBB (4 run)
freq=4773116
mean=4.773116
count PPPPP or BBBBB (5 run)
freq=2281898
mean=2.281898
count PPPPPP or BBBBBB (6 run)
freq=1107921
mean=1.107921
count PPPPPPP or BBBBBBB (7 run)
freq=274009
mean=0.274009
i stopped at 7
think you can finish if you want
maybe i look and see (C) what Don did
Sally
Thankyou I may pursue this further as I am interested in how far from the mean it is generally distributed.
Quote: charliepatrickThere is a bonus in some casinos (e.g. Empire London and others have similar idea) for how long your "Banker" run is. The casino might want to know how many long streaks occur in a shoe (I haven't checked the rules whether the count goes across shoes) and how much the bonus costs them; thus they are only interested in the longest one that starts with [your] first hand. However to analyse a side-bet one would only need to know the average length of a "Banker" run rather than how often good ones appear.
In that case, you also need to find out if a tie breaks a "banker run."
you are welcomeQuote: DanthemanThankyou I may pursue this further
and it is May
so may(b) this is good for you
well the distribution will come in handy for thatQuote: Danthemanas I am interested in how far from the mean it is generally distributed.
as i know sequences PP and BB per shoe looks to be normally distributed
but for the longer sequences like BBBBBB or PPPPPP
they are not
so averages and variances start to lose meaning for longer sequences
in other words
lots of errors exist when thinking something is normal but is not normal
maybe i dig out that data 4u when i have time
i know Don may want to beat me to it
| Avg/Shoe | Length: 2 | 3 | 4 | 5 |
|---|---|---|---|---|
| 1 | 22 | 51 | 107 | 223 |
| 2 | 42 | 94 | 201 | |
| 3 | 62 | 137 | 296 | |
| 4 | 82 | 181 | 390 | |
| 5 | 102 | 224 | ||
| 6 | 122 | 268 | ||
| 7 | 142 | 311 | ||
| 8 | 161 | 354 | ||
| 9 | 181 | 398 | ||
| 10 | 201 | |||
| 11 | 221 | |||
| 12 | 241 | |||
| 13 | 261 | |||
| 14 | 281 | |||
| 15 | 301 | |||
| 16 | 321 | |||
| 17 | 341 | |||
| 18 | 360 | |||
| 19 | 380 | |||
| 20 | 400 |
The columns indicate runs of 2, 3, 4, and 5.
Each row indicates the average number of runs per shoe, and the minimum number of cards remaining in the shoe to average at least the specified number of runs of the specified length.
For example, there will be an average of 9 or more runs of 2 or more bank wins in a row if there are 181 or more cards left in the shoe, and an average of 9 or more runs of 3 or more bank wins in a row if there are 398 or more cards left in the shoe.
In a full shoe, there are an average of 20.544 runs of two or more banker wins in a row, 9.308 runs of three or more, 4.217 runs of four or more, and 1.91 runs of five or more.
Remember that a run is only banker wins - a tie breaks the streak. Also, streaks do not carry over from one shoe to the next.
Quote: mustangsallyok
that data can easily come from the streaks of PB runs per 8 deck shoe I posted before
my observation
by making BBB BBB
a run of 6 and 5 and 4 with freq = 1
and a run of 3 and freq=2
run of 2 and freq=3
all this from one run of 6
you create a large overlap in the data
i would like to see what you want to use this for
sure hope not a betting trigger!
==========================================
so you are really interested in a sequence of PP or BB
and their frequencies per shoe
I have that data stuff but do not know where it is
you can do this yourself too
every 3 run in a run data table adds to the PP or BB (2 run)
every 4 run adds 2* the number of 4 runs to the 2 run and so on
so i get this to start
8deck - 14 card ribbon (81.2 avg # of rounds)
i only did 1 million shoes as 100 million shoes will not have that much of an average difference that matters to me
but time does
count PP or BB (2 run)
freq=24386071
mean=24.386071
count PPP or BBB (3 run)
freq=10344683
mean=10.344683
count PPPP or BBBB (4 run)
freq=4773116
mean=4.773116
count PPPPP or BBBBB (5 run)
freq=2281898
mean=2.281898
count PPPPPP or BBBBBB (6 run)
freq=1107921
mean=1.107921
count PPPPPPP or BBBBBBB (7 run)
freq=274009
mean=0.274009
i stopped at 7
think you can finish if you want
maybe i look and see (C) what Don did
Sally
I have no idea what any of that means, but I simply 'love' to hear (read) Sally talk (write). I'll go back and try to work my way thru it, prob will fall short, he says.
a Tie does not have to break a streak or a sequence like PP or BBQuote: ThatDonGuyRemember that a run is only banker wins - a tie breaks the streak.
Most Bacc players treat a Tie as a non-event but the OP has not stated this exactly except he is interested in total frequencies of PP and BB per shoe for example.
the burn method is common for 8 deck
what is different is where the cut card is placed for notification that the last round is coming next
as for the Tie how about this result sequence (not counting over-lapping sequences)
BPTP PPB
for PP or BB
frequencies:
BB = 0
PP = 2
or
PP = 1
both ways are acceptable depending on what is counted
the counting method used must be consistent too
PTP could be counted as PP if Ties are a non-event
i count is as a PP because betting for a PP after the 1st P
did not cause the 2nd bet to lose when the T showed
and I won!
some say i am lucky!
Quote: mustangsallya Tie does not have to break a streak or a sequence like PP or BB
Most Bacc players treat a Tie as a non-event but the OP has not stated this exactly except he is interested in total frequencies of PP and BB per shoe for example.
the burn method is common for 8 deck
what is different is where the cut card is placed for notification that the last round is coming next
as for the Tie how about this result sequence (not counting over-lapping sequences)
BPTP PPB
for PP or BB
frequencies:
BB = 0
PP = 2
or
PP = 1
both ways are acceptable depending on what is counted
the counting method used must be consistent too
PTP could be counted as PP if Ties are a non-event
i count is as a PP because betting for a PP after the 1st P
did not cause the 2nd bet to lose when the T showed
and I won!
some say i am lucky!
Like most players i consider tie as a non event also
Quote: DanthemanLike most players i consider tie as a non event also
Normally, I do as well, but the first post on page 2 refers to a bonus bet, so who knows how the casino treats ties in terms of streaks.
Quote: mustangsally
so i get this to start
8deck - 14 card ribbon (81.2 avg # of rounds)
i only did 1 million shoes as 100 million shoes will not have that much of an average difference that matters to me
but time does
count PP or BB (2 run)
freq=24386071
mean=24.386071
count PPP or BBB (3 run)
freq=10344683
mean=10.344683
count PPPP or BBBB (4 run)
freq=4773116
mean=4.773116
count PPPPP or BBBBB (5 run)
freq=2281898
mean=2.281898
count PPPPPP or BBBBBB (6 run)
freq=1107921
mean=1.107921
count PPPPPPP or BBBBBBB (7 run)
freq=274009
mean=0.274009
Sally
Sally does the 81.2 hands per shoe include ties?
I would assume it may as this number seems high for resolved hands.
yesQuote: DanthemanSally does the 81.2 hands per shoe include ties?
I would assume it may as this number seems high for resolved hands.
very good
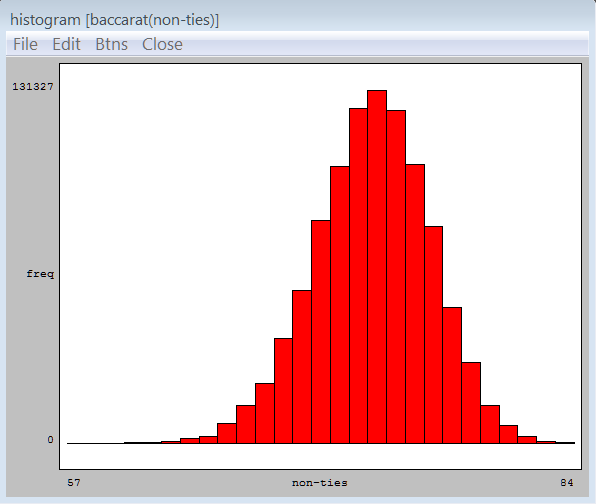
here is the distribution from a sim
       group         middle     freq  freq/100
----------------------------------------------
57.50 <= x < 58.50    58.00       39     0.00%
58.50 <= x < 59.50    59.00        0
59.50 <= x < 60.50    60.00       39     0.00%
60.50 <= x < 61.50    61.00      155     0.02%
61.50 <= x < 62.50    62.00      384     0.04%
62.50 <= x < 63.50    63.00      545     0.05%
63.50 <= x < 64.50    64.00     1662     0.17%
64.50 <= x < 65.50    65.00     2517     0.25%
65.50 <= x < 66.50    66.00     7305     0.73%
66.50 <= x < 67.50    67.00    14051     1.41%
67.50 <= x < 68.50    68.00    22189     2.22%
68.50 <= x < 69.50    69.00    38847     3.88%
69.50 <= x < 70.50    70.00    57014     5.70%
70.50 <= x < 71.50    71.00    83004     8.30%
71.50 <= x < 72.50    72.00   103204    10.32%
72.50 <= x < 73.50    73.00   124732    12.47%
73.50 <= x < 74.50    74.00   131327    13.13%
74.50 <= x < 75.50    75.00   123962    12.40%
75.50 <= x < 76.50    76.00   103820    10.38%
76.50 <= x < 77.50    77.00    80876     8.09%
77.50 <= x < 78.50    78.00    50483     5.05%
78.50 <= x < 79.50    79.00    29971     3.00%
79.50 <= x < 80.50    80.00    14254     1.43%
80.50 <= x < 81.50    81.00     6451     0.65%
81.50 <= x < 82.50    82.00     2434     0.24%
82.50 <= x < 83.50    83.00      543     0.05%
83.50 <= x < 84.50    84.00      192     0.02%

----------------------------------------------
                    grouped data
items:                  1000000

minimum value:               58.00
first quartile:              72.00
median:                      74.00
third quartile:              76.00
maximum value:               84.00

mean value:                  73.74
midrange:                    71.00

range:                       26.00
interquartile range:          4.00
mean abs deviation:           2.45

sample variance (n):          9.46
sample variance (n-1):        9.46
sample std dev (n):           3.08
sample std dev (n-1):         3.08

----------------------------------------------
                  cumulative
----------------------------------------------
57.50 <= x < 58.50    58.00       39     0.00%
58.50 <= x < 59.50    59.00       39     0.00%
59.50 <= x < 60.50    60.00       78     0.01%
60.50 <= x < 61.50    61.00      233     0.02%
61.50 <= x < 62.50    62.00      617     0.06%
62.50 <= x < 63.50    63.00     1162     0.12%
63.50 <= x < 64.50    64.00     2824     0.28%
64.50 <= x < 65.50    65.00     5341     0.53%
65.50 <= x < 66.50    66.00    12646     1.26%
66.50 <= x < 67.50    67.00    26697     2.67%
67.50 <= x < 68.50    68.00    48886     4.89%
68.50 <= x < 69.50    69.00    87733     8.77%
69.50 <= x < 70.50    70.00   144747    14.47%
70.50 <= x < 71.50    71.00   227751    22.78%
71.50 <= x < 72.50    72.00   330955    33.10%
72.50 <= x < 73.50    73.00   455687    45.57%
73.50 <= x < 74.50    74.00   587014    58.70%
74.50 <= x < 75.50    75.00   710976    71.10%
75.50 <= x < 76.50    76.00   814796    81.48%
76.50 <= x < 77.50    77.00   895672    89.57%
77.50 <= x < 78.50    78.00   946155    94.62%
78.50 <= x < 79.50    79.00   976126    97.61%
79.50 <= x < 80.50    80.00   990380    99.04%
80.50 <= x < 81.50    81.00   996831    99.68%
81.50 <= x < 82.50    82.00   999265    99.93%
82.50 <= x < 83.50    83.00   999808    99.98%
83.50 <= x < 84.50    84.00  1000000   100.00%
the photo
not quite a normal distribution
hey, move over
for totals just add the ev and variance like so (totals are in another post)
11.90 + 12.45 = 24.35 (mean)
7.87 + 7.60 = 15.47 (variance)
standard deviation = 3.93
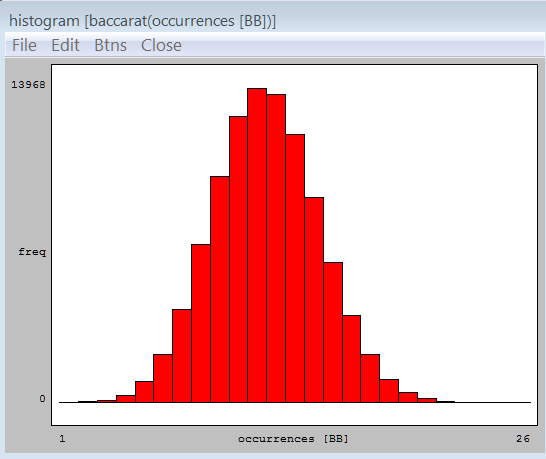
sequence BB
group middle freq freq/100
---------------------------------------------
1.50 <= x < 2.50 2.00 2 0.00%
2.50 <= x < 3.50 3.00 23 0.02%
3.50 <= x < 4.50 4.00 92 0.09%
4.50 <= x < 5.50 5.00 306 0.31%
5.50 <= x < 6.50 6.00 920 0.92%
6.50 <= x < 7.50 7.00 2133 2.13%
7.50 <= x < 8.50 8.00 4157 4.16%
8.50 <= x < 9.50 9.00 7027 7.03%
9.50 <= x < 10.50 10.00 10058 10.06%
10.50 <= x < 11.50 11.00 12705 12.70%
11.50 <= x < 12.50 12.00 13968 13.97%
12.50 <= x < 13.50 13.00 13694 13.69%
13.50 <= x < 14.50 14.00 11923 11.92%
14.50 <= x < 15.50 15.00 9114 9.11%
15.50 <= x < 16.50 16.00 6217 6.22%
16.50 <= x < 17.50 17.00 3846 3.85%
17.50 <= x < 18.50 18.00 2113 2.11%
18.50 <= x < 19.50 19.00 1004 1.00%
19.50 <= x < 20.50 20.00 457 0.46%
20.50 <= x < 21.50 21.00 165 0.16%
21.50 <= x < 22.50 22.00 57 0.06%
22.50 <= x < 23.50 23.00 13 0.01%
23.50 <= x < 24.50 24.00 4 0.00%
24.50 <= x < 25.50 25.00 1 0.00%
25.50 <= x < 26.50 26.00 1 0.00%
---------------------------------------------
grouped data
items: 100000
minimum value: 2.00
first quartile: 11.00
median: 12.00
third quartile: 14.00
maximum value: 26.00
mean value: 12.45 <<<<<
midrange: 14.00
range: 24.00
interquartile range: 3.00
mean abs deviation: 2.26
sample variance (n): 7.87
sample variance (n-1): 7.87 <<<<<
sample std dev (n): 2.81
sample std dev (n-1): 2.81
---------------------------------------------
cumulative
---------------------------------------------
1.50 <= x < 2.50 2.00 2 0.00%
2.50 <= x < 3.50 3.00 25 0.02%
3.50 <= x < 4.50 4.00 117 0.12%
4.50 <= x < 5.50 5.00 423 0.42%
5.50 <= x < 6.50 6.00 1343 1.34%
6.50 <= x < 7.50 7.00 3476 3.48%
7.50 <= x < 8.50 8.00 7633 7.63%
8.50 <= x < 9.50 9.00 14660 14.66%
9.50 <= x < 10.50 10.00 24718 24.72%
10.50 <= x < 11.50 11.00 37423 37.42%
11.50 <= x < 12.50 12.00 51391 51.39%
12.50 <= x < 13.50 13.00 65085 65.08%
13.50 <= x < 14.50 14.00 77008 77.01%
14.50 <= x < 15.50 15.00 86122 86.12%
15.50 <= x < 16.50 16.00 92339 92.34%
16.50 <= x < 17.50 17.00 96185 96.18%
17.50 <= x < 18.50 18.00 98298 98.30%
18.50 <= x < 19.50 19.00 99302 99.30%
19.50 <= x < 20.50 20.00 99759 99.76%
20.50 <= x < 21.50 21.00 99924 99.92%
21.50 <= x < 22.50 22.00 99981 99.98%
22.50 <= x < 23.50 23.00 99994 99.99%
23.50 <= x < 24.50 24.00 99998 100.00%
24.50 <= x < 25.50 25.00 99999 100.00%
25.50 <= x < 26.50 26.00 100000 100.00%
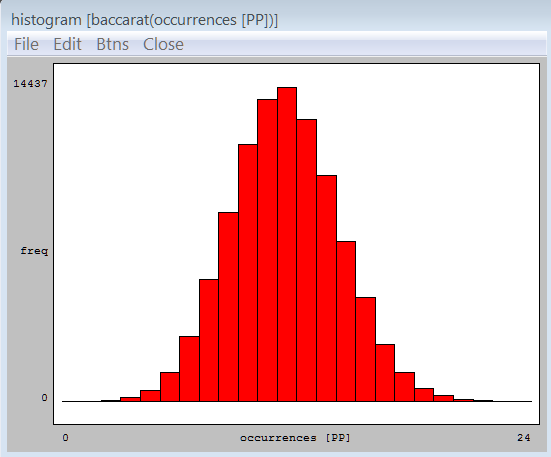
sequence PP
group middle freq freq/100
---------------------------------------------
0.50 <= x < 1.50 1.00 4 0.00%
1.50 <= x < 2.50 2.00 1 0.00%
2.50 <= x < 3.50 3.00 30 0.03%
3.50 <= x < 4.50 4.00 159 0.16%
4.50 <= x < 5.50 5.00 507 0.51%
5.50 <= x < 6.50 6.00 1331 1.33%
6.50 <= x < 7.50 7.00 2976 2.98%
7.50 <= x < 8.50 8.00 5591 5.59%
8.50 <= x < 9.50 9.00 8709 8.71%
9.50 <= x < 10.50 10.00 11829 11.83%
10.50 <= x < 11.50 11.00 13900 13.90%
11.50 <= x < 12.50 12.00 14437 14.44%
12.50 <= x < 13.50 13.00 12970 12.97%
13.50 <= x < 14.50 14.00 10407 10.41%
14.50 <= x < 15.50 15.00 7373 7.37%
15.50 <= x < 16.50 16.00 4782 4.78%
16.50 <= x < 17.50 17.00 2622 2.62%
17.50 <= x < 18.50 18.00 1351 1.35%
18.50 <= x < 19.50 19.00 611 0.61%
19.50 <= x < 20.50 20.00 274 0.27%
20.50 <= x < 21.50 21.00 91 0.09%
21.50 <= x < 22.50 22.00 32 0.03%
22.50 <= x < 23.50 23.00 10 0.01%
23.50 <= x < 24.50 24.00 3 0.00%
---------------------------------------------
grouped data
items: 100000
minimum value: 1.00
first quartile: 10.00
median: 12.00
third quartile: 14.00
maximum value: 24.00
mean value: 11.90 <<<<<
midrange: 12.50
range: 23.00
interquartile range: 4.00
mean abs deviation: 2.19
sample variance (n): 7.60 <<<<<
sample variance (n-1): 7.60
sample std dev (n): 2.76
sample std dev (n-1): 2.76
---------------------------------------------
cumulative
---------------------------------------------
0.50 <= x < 1.50 1.00 4 0.00%
1.50 <= x < 2.50 2.00 5 0.00%
2.50 <= x < 3.50 3.00 35 0.04%
3.50 <= x < 4.50 4.00 194 0.19%
4.50 <= x < 5.50 5.00 701 0.70%
5.50 <= x < 6.50 6.00 2032 2.03%
6.50 <= x < 7.50 7.00 5008 5.01%
7.50 <= x < 8.50 8.00 10599 10.60%
8.50 <= x < 9.50 9.00 19308 19.31%
9.50 <= x < 10.50 10.00 31137 31.14%
10.50 <= x < 11.50 11.00 45037 45.04%
11.50 <= x < 12.50 12.00 59474 59.47%
12.50 <= x < 13.50 13.00 72444 72.44%
13.50 <= x < 14.50 14.00 82851 82.85%
14.50 <= x < 15.50 15.00 90224 90.22%
15.50 <= x < 16.50 16.00 95006 95.01%
16.50 <= x < 17.50 17.00 97628 97.63%
17.50 <= x < 18.50 18.00 98979 98.98%
18.50 <= x < 19.50 19.00 99590 99.59%
19.50 <= x < 20.50 20.00 99864 99.86%
20.50 <= x < 21.50 21.00 99955 99.96%
21.50 <= x < 22.50 22.00 99987 99.99%
22.50 <= x < 23.50 23.00 99997 100.00%
23.50 <= x < 24.50 24.00 100000 100.00%
what they look like individually
BB
PP
==========================
added:
for enjoyment
I added this file to my online folder (link in me blog) one can get the distribution from this file if wants
10,000 shoes to play with
1-10k-8.13-bacc-seq.txt
(abouts 6.1MB)
here is direct link
http://1drv.ms/1A0xunt
it opens fine (in a few seconds and scrolls) in my Google Chrome browser
i do not know about other browser performance
one can download it too and have it forever
example